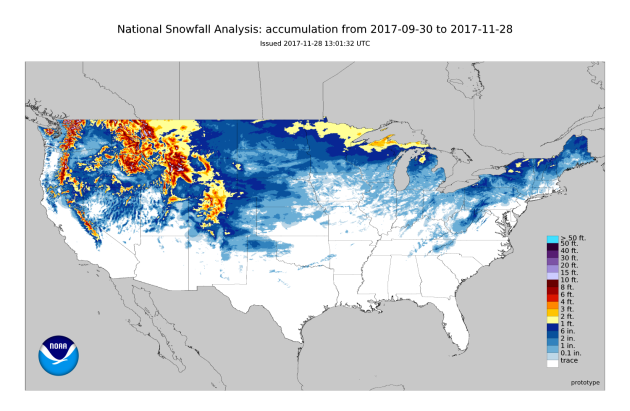
National Snowfall Accumulation Since September 30th
Here’s an interesting image, which suggests how much snowfall accumulation there has been across the county so far this year. Note that the heaviest accumulations have been across the higher elevations in the Western US, especially across the Northern Rockies and also across the Sierra Nevada Range and across the Cascades. There have also been fairly decent accumulations across the Western Great Lakes region.
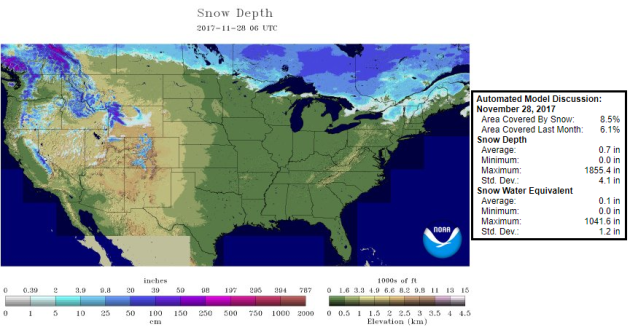
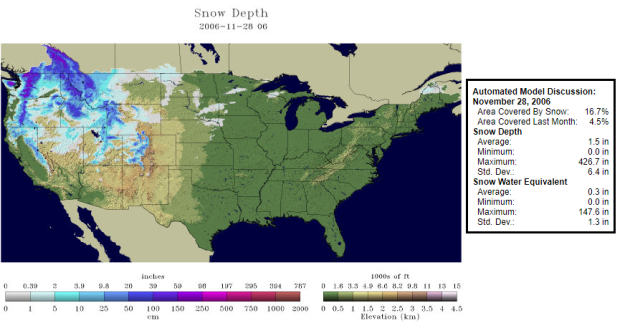
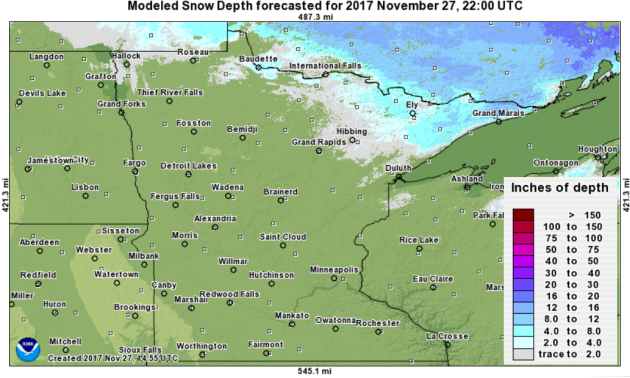
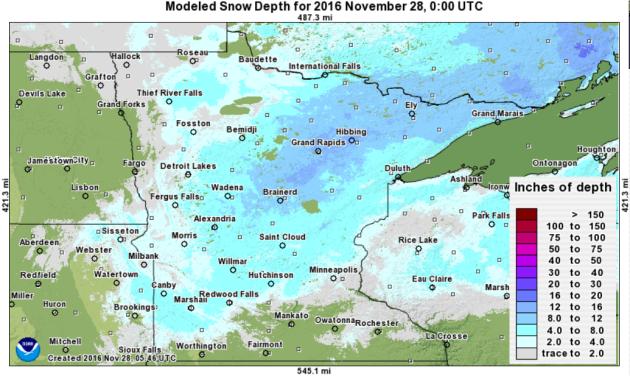
National Snow Cover 2017 vs. 2016
Despite seeing as much snow as we’ve seen so far this season, recent mild weather has melted a lot of snow across the nation. According to NOAA’s NOHRSC, only 8.5% of the nation was covered in snow as of Tuesday, November 8th. However, at this time last year, 16.7% of the nation was covered in snow and mainly across the Western US.
.gif)
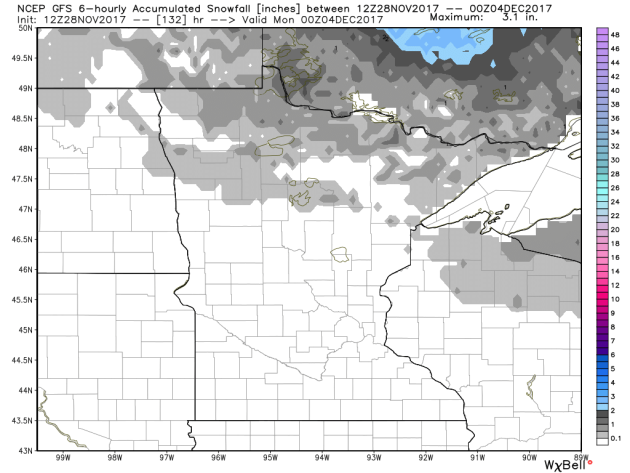
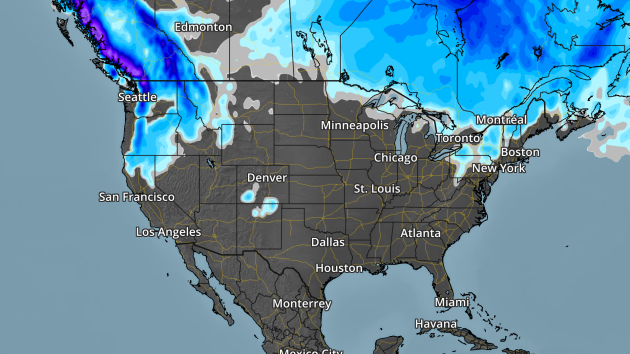
Minimal Snow Chances Ahead
Here’s the snowfall potential through the 3rd day of December, which shows minimal snow chances over the next several days. Snow lovers will have to continue being patient as Old Man Winter takes his sweet time showing up.
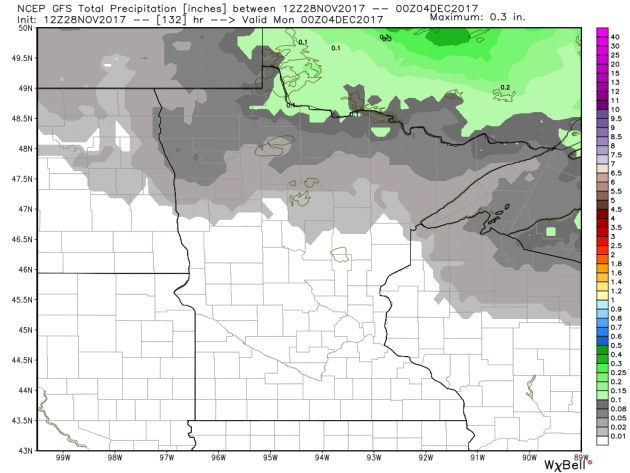
Minimal Precipitation Chances Ahead
Here’s the precipitation chance through Sunday, which suggests mostly dry conditions continuing across much of the state with the exception of the northern third of the state.
 _________________________________________________________________
 ___________________________________________________________
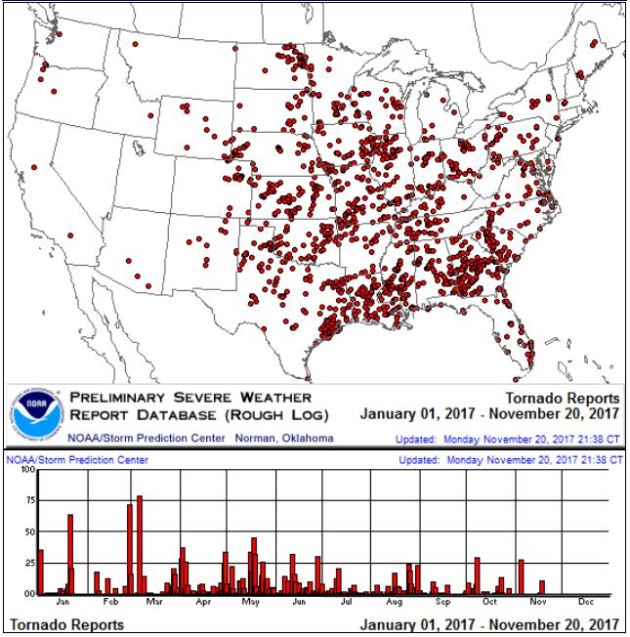
It certainly has been a fairly active first half of 2017 with 1,509 preliminary tornado reports through November 26th. Note that this is the most tornadoes through that date since 2011, when there were 1,880 reports. The map below shows the distribution of the tornadoes so far this year.
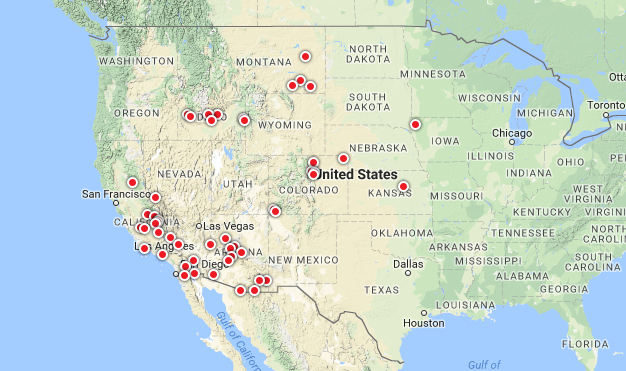
PRELIMINARY 2017 Tornado Count
According to NOAA’s SPC, the PRELIMINARY 2017 tornado count is 1,509 (through November 26th). Note that is the most active year for tornadoes since 2011, when there were 1,880 tornadoes. Notice that the only other year with more tornadoes than this year was in 2008, which ended with a whopping 2,140 tornadoes nationwide.
.png)
_____________________________________________________________________
National Weather Hazards Ahead…
1.) Heavy precipitation across portions of the Pacific Northwest, Fri-Sat, Dec 1-Dec 2.
2.) Heavy snow across portions of the Cascades, Fri-Sat, Dec 1-Dec 2.
3.) Heavy snow across portions of the Northern Rockies and the Northern Great Basin, Sat, Dec 2.
4.) Heavy snow across portions of the Central Rockies and the Central Great Basin, Sun, Dec 3.
5.) Flooding occurring or imminent across portions of the Pacific Northwest.
6.) Heavy rain across portions of the Lower Mississippi Valley, Wed-Thu, Dec 6-Dec 7.
7.) Heavy precipitation across portions of the Alaska Panhandle and mainland Alaska, Sun-Tue, Dec 3-Dec 5.
8.) High winds across portions of the Alaska Panhandle, mainland Alaska, and the Aleutians, Fri, Dec 1 and Mon-Tue, Dec 4-Dec 5.
9.) High significant wave heights for coastal portions of the Alaska Panhandle and mainland Alaska, Mon, Dec 4.
10.) Slight risk of much below normal temperatures from Texas, along the Gulf Coast, up through parts of the Midwest and Mid-Atlantic, Fri-Mon, Dec 8-Dec 11.
11.) Severe Drought across the Lower Mississippi Valley, the Northern Plains, Hawaii, the Northern Rockies, the Middle Mississippi Valley, the Southern Plains, and the Southwest.
.png)
_____________________________________________________________________
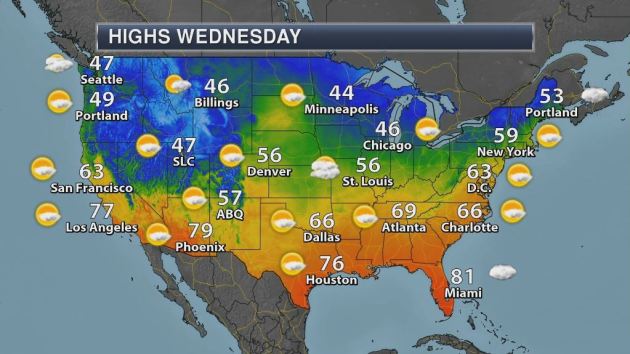
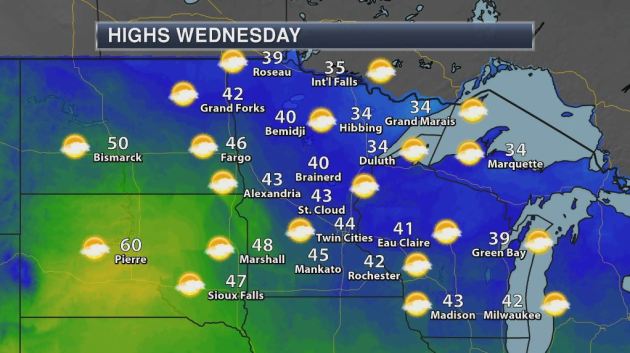
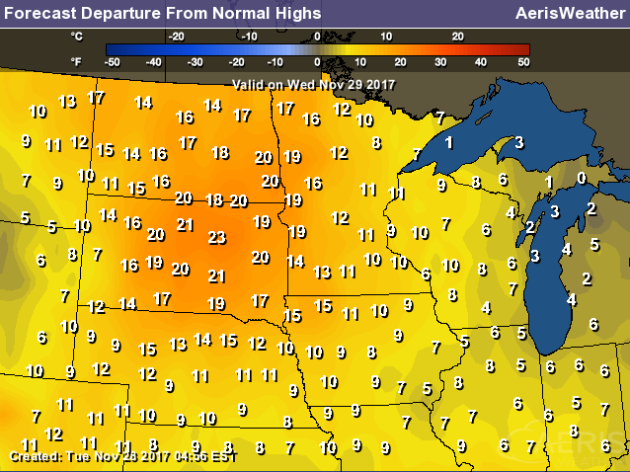
Here’s a look at high temperatures across the nation on Wednesday, which suggests that readings will still be above average for much of the nation. However the only areas that will below average will be the Oklahoma & Texas Panhandle as well as much of Maine.
Here’s the weather outlook through Thursday, which shows a fairly continuous stream of Pacific moisture heading through parts of the Northwestern US. These waves of energy look to dimish some as they head east of the Rockies, but there a bigger wave of moisture that moves into the Northeast with areas of rain and snow.
.gif)
According to NOAA’s WPC, the 5 day precipitation outlook suggests areas of heavier moisture in the Northwestern US with several inches possible in the higher elevations of the Olympics and the Northern Cascades. Some locations in the Northern Rockies could also see some 1″+ liquid tallies through the weekend. As the storm system move east through the week ahead, there may be some isolated heavier tallies across the Central US and also in the Northeast.
.gif)
By Paul Douglas
________________________________________________________________________
THURSDAY: Plenty of sun, still too quiet. Winds: W 8-13. High: 47.
FRIDAY: Intervals of sun. What December? Winds: S 8-13. Wake-up: 31. High: 49.
SATURDAY: Mix of clouds and sun. Dry sky. Winds: W 5-10. Wake-up: 33. High: 46.
This Day in Weather History
November 29th
1991: Parts of central Minnesota receive heavy snow including a record 16 inches of snow in New Ulm.
1835: A low of 11 below zero is reported at Ft. Snelling.
________________________________________________________
Average High/Low for Minneapolis
November 29th
Average High: 33F (Record: 62F set in 1998)
Average Low: 19F (Record: -25F set in 1875)
Record Rainfall: 1.38″ set in 1991
Record Snowfall: 12.6″ set in 1991
_________________________________________________________
Sunrise/Sunset Times for Minneapolis
November 29th
Sunrise: 7:28am
Sunset: 4:34pm
Hours of Daylight: ~9 hours 5 mins
Daylight LOST since yesterday: ~1 minutes and 39 seconds
Daylight LOST since summer solstice (June 20th): 6 hours & 32 minutes
__________________________________________________________
Moon Phase for November 29th at Midnight
3.4 Day Until Full “Cold” Moon
Dec. 3, 9:47 a.m. CST – Full Cold Moon. On occasion, this moon was also called the Moon before Yule. December is also the month in which the winter cold fastens its grip. Sometimes this moon is referred to as the Full Long Nights Moon — a fitting name, since nights are longer at this time of year, and the moon appears above the horizon for a long time. This particular full moon makes its highest arc across the sky on this day because that’s when it appears diametrically opposite to the low sun. The moon will also arrive at perigee about 17 hours later, at 4:00 a.m. EST on Dec. 4, at a distance of 222,135 miles (357,492 kilometers) from Earth. This will be the biggest full moon of 2017 and the only “supermoon” of the year. Very high ocean tidescan be expected during the next two or three days, thanks to the coincidence of perigee with full moon.
_________________________
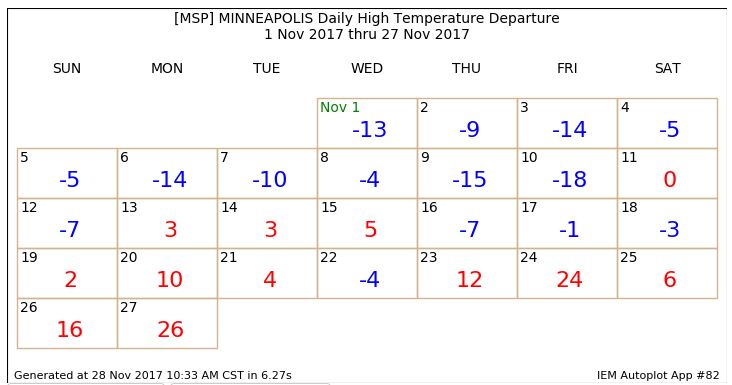
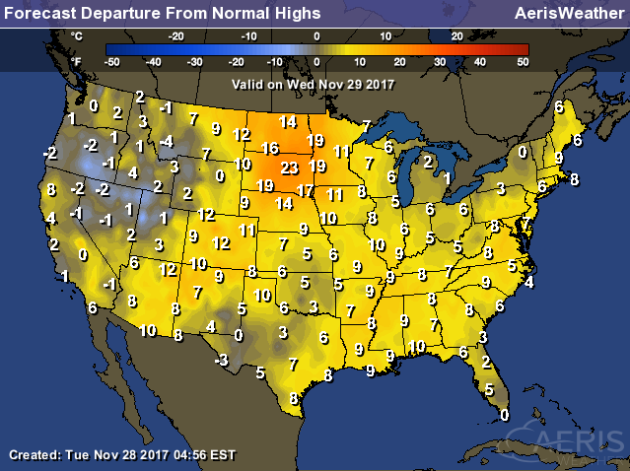
Wednesday will be another VERY mild day across the region with highs warming into the 30s and 40s across much of the state, which will be 10F to 20F above average. However, note that parts of South Dakota could be near 60F, which will be nearly 20F+ above average!
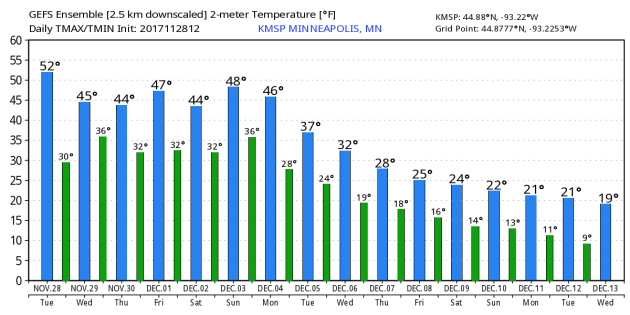
Here’s the temperature outlook through December 13th, which shows very mild temps continuing through the week ahead with readings warming into the 40s to near 50F. The extended forecast suggests temperatures dipping into the 20s and slightly below average as we approach the 2nd weekend of December. Keep in mind that the average high by December 13th is 27F and the average low is 13F.
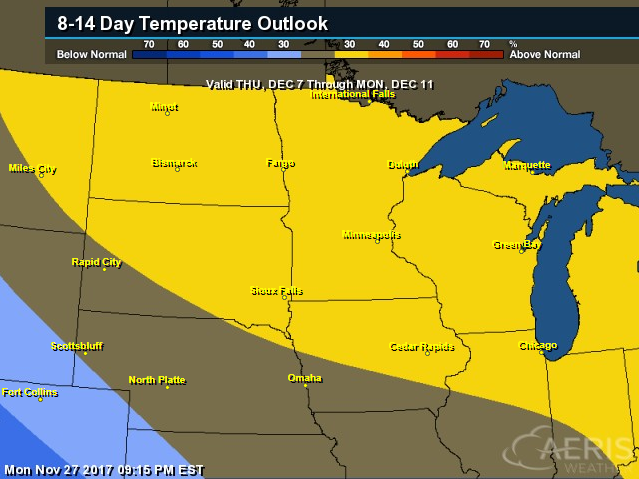
8 to 14 Day Temperature Outlook
Here’s the temperature outlook from into the early part of December, which suggests that temperatures will still be above average for much of the Midwest.
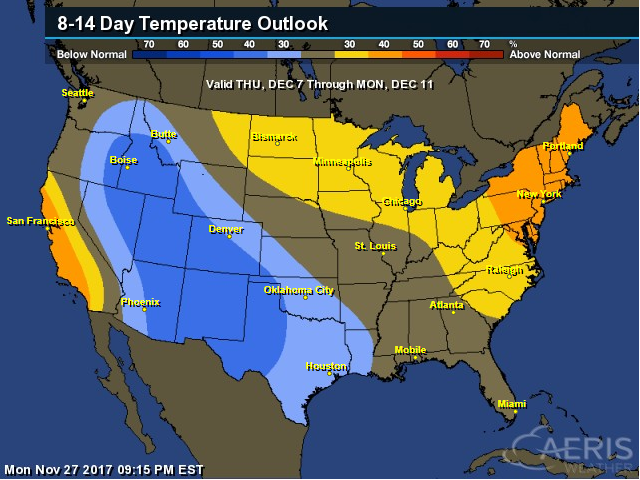
6 to 10 Day Temperature Outlook
According to NOAA’s CPC – much of the nation will remain above average as we head into the early part of December. The only spot that may see below average temps is in the Western US.
“7 Shining Facts About the Sun”
“Isaac Asimov described the solar system as the Sun, Jupiter, and debris. He wasn’t wrong—the Sun is 99.8 percent of the mass of the solar system. But what is the giant ball of fire in the sky? How does it behave and what mysteries remain? Mental Floss spoke to Angelos Vourlidas, an astrophysicist and the supervisor of the Solar Section at Johns Hopkins University Applied Physics Laboratory, to learn what scientists know about the Sun—and a few things they don’t.”
1. IT’S A GIANT NUCLEAR FUSION REACTOR.
“The Sun is so incomprehensibly big that it’s almost pointless to bother trying to imagine its size. Our star is 870 million miles across. It is so big that 1.3 million Earths could fit inside of it. The Sun is 4.5 billion years old, and should last for another 6.5 billion years. When it faces the final curtain, it will not go supernova, however, as lacks the mass for such an end. Rather, the Sun will grow to a red giant—destroying the Earth in the process, if we last that long, which we won’t—and then contract down to become a white dwarf.”
See more from Mental Floss HERE:
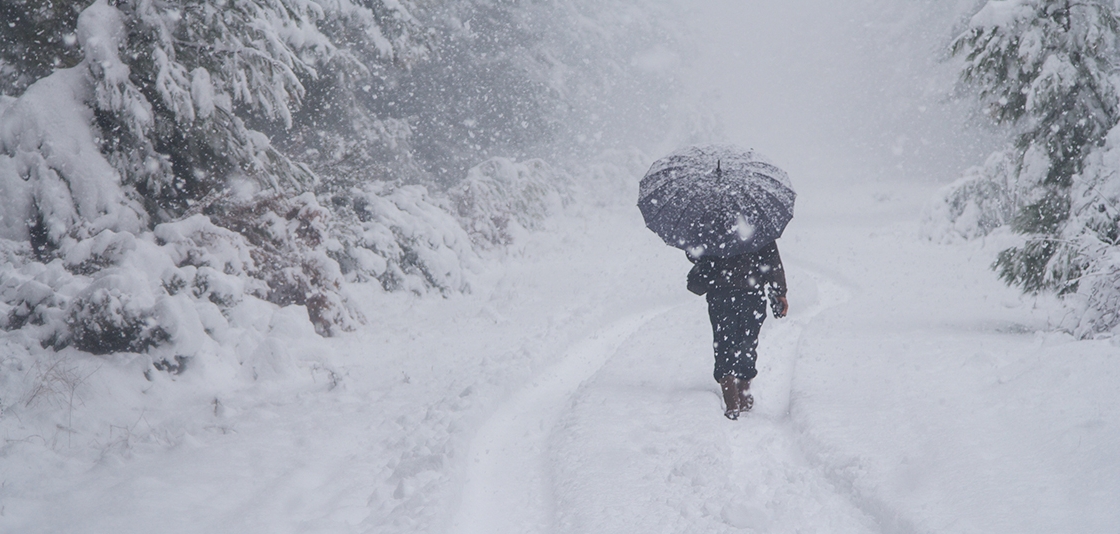
___________________________________________________________________________“It’s Going to Be a Snowy Winter, According to the Farmer’s Almanac”
“There may not be a polar vortex this winter, but it may be a bit wetter than usual. The Farmers’ Almanac released its yearly long-range weather predictions, and it appears that winter is definitely coming for some regions throughout the U.S. While described as “normal” as far as temperatures go, the Almanac predicted that regions throughout the United States will experience “above-normal” precipitation levels, especially in the Northeast and Southeast. Great Lakes: The area around the Great Lakes will be cold and snowier than usual this winter. And, keeping with stereotypes for Midwestern weather, these areas will experience swings in the temperature from warm to cold.”
See more from Real Simple HERE:
_____________________________________________________________________________
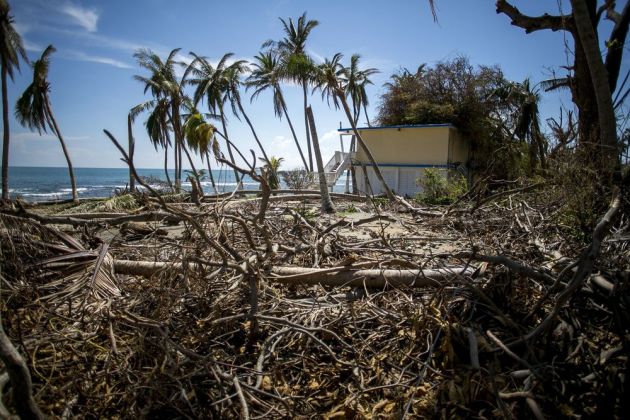
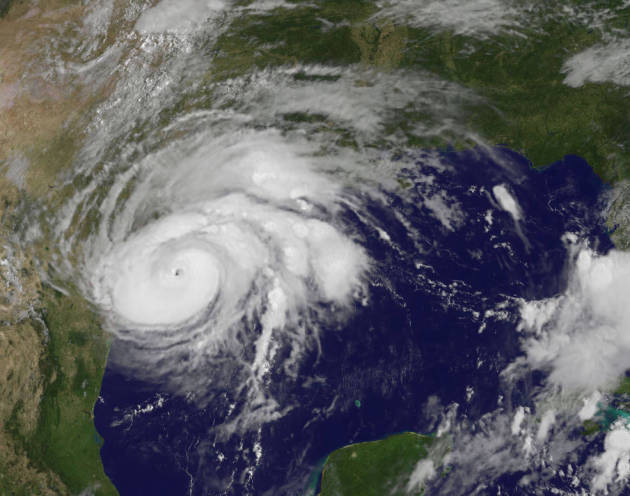
“The Most Expensive U.S. Hurricane Season Ever: By the Numbers”
“This year’s U.S. Atlantic hurricane season is officially the most expensive ever, racking up $202.6 billion in damages since the formal start on June 1. The costs tallied by disaster modelers Chuck Watson and Mark Johnson surpass anything they’ve seen in previous years. That shouldn’t come as a complete surprise: In late August, Hurricane Harvey slammed into the Gulf Coast, wreaking havoc upon the heart of America’s energy sector. Then Irma struck Florida, devastating the Caribbean islands on the way. Hurricane Maria followed shortly after, wiping out power to all of Puerto Rico. And the season’s not over yet: It officially ends on Nov. 30.”
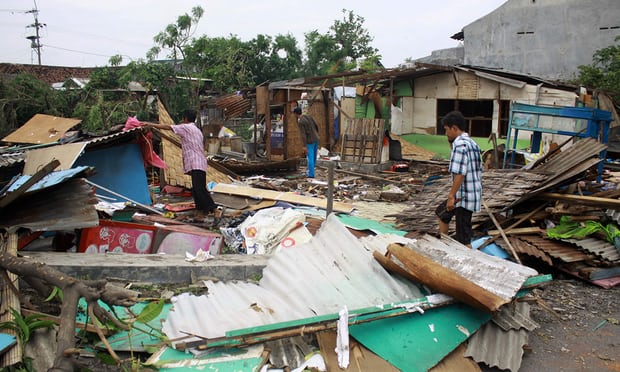
___________________________________________________________“World weatherwatch: tornado leaves a trail of destruction in Java”
“Twisters are not normally something we hear about outside of Tornado Alley in the US. However, last Wednesday, a tornado was on the ground for five minutes and cut a path of chaos through a densely populated area in the Indonesian province of East Java. A trail of destruction was left in the Sidoarjo area, near Surabaya, home to 2 million people. There were no recorded fatalities, but 35 were injured and more than 600 homes damaged. Tornadoes are considered rare in this part of the world and are usually far less powerful than those observed in the Great Plains of the US. However, due to the dense population of Indonesia, damage can often be significant with a large number of people affected even if the tornado is considered weak. A record-breaking heatwave is continuing in southern Australia. Temperatures are soaring into the low 30s and Hobart, the capital of Tasmania, witnessed six consecutive days with maximum temperatures above 26C, breaking a 122-year record. An unusually stagnant weather pattern is prolonging the hot spell and there are fears that the electricity grid will not be able to keep up with demand as the public turn up the air conditioning over the coming week.”
See more from The Guardian HERE:
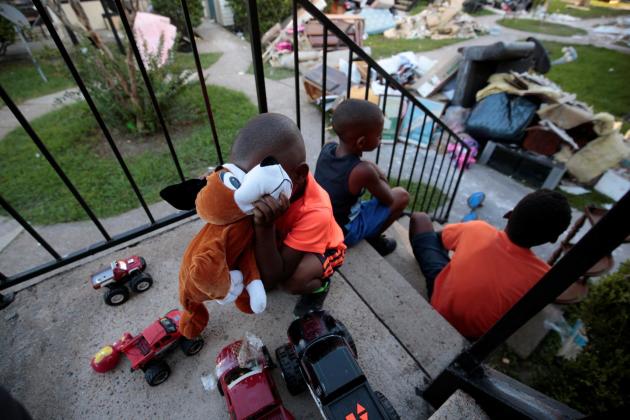
_______________________________________________________________________“HURRICANE HARVEY VICTIMS: MORE THAN 20,000 CHILDREN IN HOUSTON ARE HOMELESS, REPORT SHOWS”
“The destruction levied by Hurricane Harvey still reverberates across Houston. According to local reports, tens of thousands of Houston residents lack stable housing three months after the storm made landfall, living in trailers, tents, shelters, and in what the Houston Chronicle calls “barely habitable homes.” Over 22,000 of those without a home are children, while some 47,000 Harvey victims stay in hotel rooms paid for by the federal government at a tune of $2.8 million a day. Officials say that the blame falls on government agencies at all levels for not doling out aid fast enough. “We are behind where we need to be, city, state and federal,” Tom McCasland, director of Houston’s housing and community development department, told the Chronicle earlier this week. “It’s time to get these programs out in the community, get hammers swinging, get people moving back into their homes.”
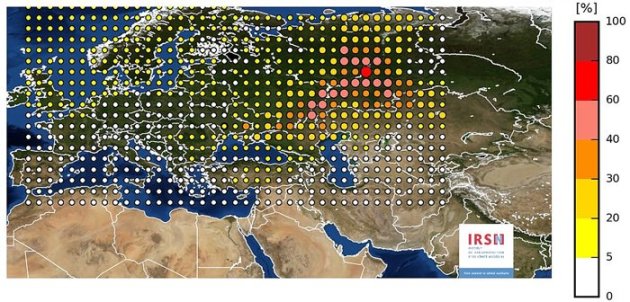
____________________________________________________________________________“Here’s What You Need to Know About That Mysterious Radiation Cloud Over Europe”
“After weeks of silence and denials, Russia has confirmed that it too has detected evidence of a mysterious radiation cloud floating above much of Europe, observing a dramatic radiation spike above Russia’s Ural Mountains. The acknowledgement comes after a number of other European nations suggested Russia was the probable origin of the unexplained radiation surge, which was first detected by numerous monitoring stations back in September. Up until this point, Russian authorities had only disclosed they were not aware of any nuclear accidents on their turf, issuing a statement saying “[n]one of the enterprises of the Russian nuclear industry has recorded radiation levels that exceed the norm”. But now Russia’s meteorological service, Roshydromet, has for the first time corroborated findings made by the French Institute for Radiation Protection and Nuclear Safety (IRNS). They acknowledged “extremely high contamination” above the Ural Mountains, detecting levels of the radioactive isotope ruthenium–106 up to almost 1,000 times the normal amount.”
See more from Science Alert HERE:
_______________________________________________________________________“Think Hurricane Harvey’s Flooding Was Bad? Just Wait until 2100”
“This season Hurricane Harvey slammed Houston and surrounding southeastern Texas with torrential rains that broke records and created what felt to many like biblical-scale flooding. Harvey was an unusually wet and potent storm by today’s standards—and it may provide a glimpse of North America’s future. A new study predicts the continent will experience more storms that dump similarly huge volumes of rain by the end of the century, thanks to climate change. For the study, published Monday in Nature Climate Change, researchers looked at how global warming will affect storms, called mesoscale convective systems, in North America. These are clusters of smaller storms that grow into one another and eventually act as one. Hurricanes can fall into this category, but the majority of such events in North America are actually giant thunderstorms. They mainly occur east of the Continental Divide, are relatively long-lived and span at least 60 miles (about 100 kilometers)—although they can grow large enough to cover a state as big as Kansas, according to Andreas Prein, the study’s lead author and atmospheric scientist at the National Center for Atmospheric Research.”
See more from Scientific American
_______________________________________________________________“Every Day, This Satellite Company Takes A Snapshot Of The Entire Planet”
“Planet wants to analyze and index its 1.4 million daily photos to enable researchers to track Earth’s physical changes over time. Six years ago, a group of scientists and engineers, among them three former NASA employees, gathered in a garage in Cupertino, California, with a goal: to found a company whose mission was to capture an image of Earth’s entire landmass every day. To do so, Planet Labs, as they called themselves (they’ve since rebranded to become Planet), had to use satellites small enough and cost-effective enough to launch en masse in a “fleet” that could traverse Earth, snapping images and collecting data. They settled on CubeSat satellites–devices no bigger than a shoebox, and built with consumer smartphone technology for imaging and data collection (the first of this type of CubeSat were built by NASA’s Ames Research Center and inspired by first-generation Google Android phones. The small remote-controlled box, equipped with sensors, floated two miles above the Earth via balloons). As Planet evolved, they began designing and building their own mini satellites, which they call “doves,” and updated their technology simply by switching out the smartphone used for the latest model.”

__________________________________________________________“Mysterious Particles Are Slamming Into Earth—But Why?”
“New observations stir up debate over an abundance of antimatter found in our atmosphere. A cosmic engine is hurling strange particles at Earth—and new observations, published today in the journal Science, are complicating the hunt for the culprit. In 2008, the space-based instrument PAMELA detected an overabundance of particles called positrons in Earth’s atmosphere. These particles are a form of antimatter, a substance that is the opposite of normal matter. When an antimatter positron encounters its opposite particle, the two can annihilate one another and vanish in a tiny puff of energy that often includes gamma-rays, which scientists can detect. (Read about the first antimatter found orbiting Earth.) Figuring out the source of this weird positron excess is exciting, because it helps scientists understand the highest-energy phenomena in the nearby universe, which in turn could help solve some of the big mysteries in physics.”
See more from National Geographic HERE:

__________________________________________________________________“Salting Roads Saves Lives, But Also Takes a Major Environmental Toll”
“This winter, around 17 million tons of rock salt from mines in the U.S. and all over the world will be applied to icy roads across the United States. A growing body of research shows that this salt has become an environmental pollutant, and that we need to start considering alternatives. For most people in states where it snows, seeing rock salt spread on sidewalks and roads is a common sight. But what happens to the salt after the snow melts is less widely understood. Runoff, full of road salt, can flow into nearby streams or ponds and can stay in the environment long after winter is over. Just one teaspoon of salt is enough to permanently pollute five gallons of groundwater used for drinking. Once in the water, salt, or sodium chloride, is difficult to remove. Aquatic life in freshwater ponds, lakes, streams and rivers can also be affected by this runoff, according to Steven Brady, assistant professor in the biology department at Southern Connecticut State University. “It’s salty enough that you can actually taste the salt in these ponds,” Brady told Earther.”

____________________________________________________________________________Thanks for checking in and don’t forget to follow me on Twitter @TNelsonWX