__________________________________________________________________________

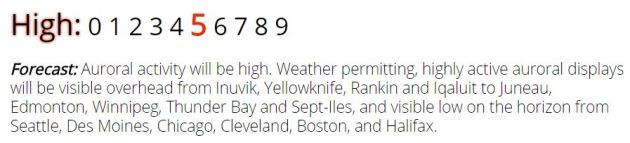
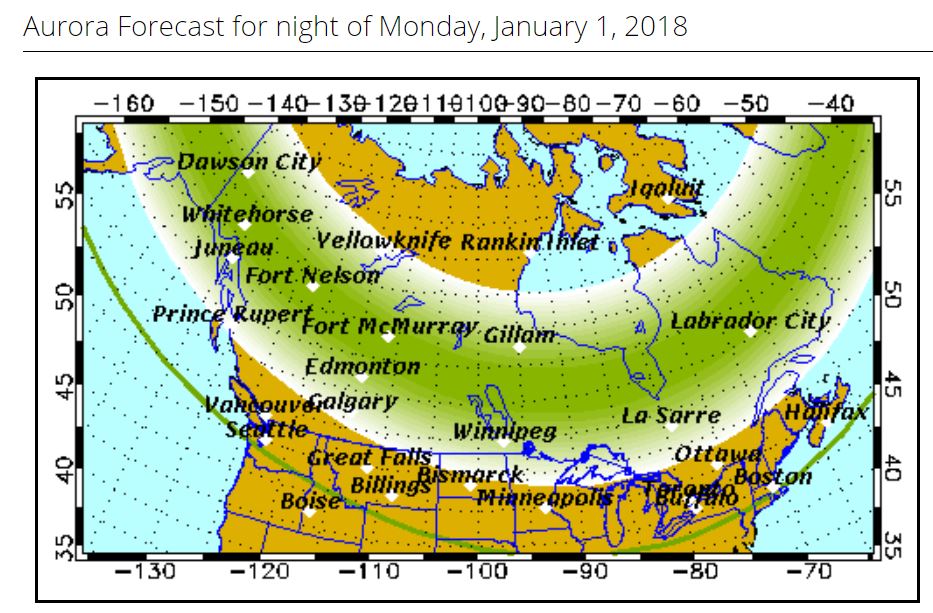
Northern Lights Potential
.gif)
____________________________________________________________________
____________________________________________________________________________
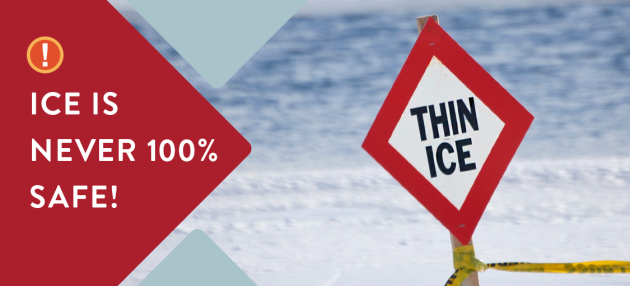
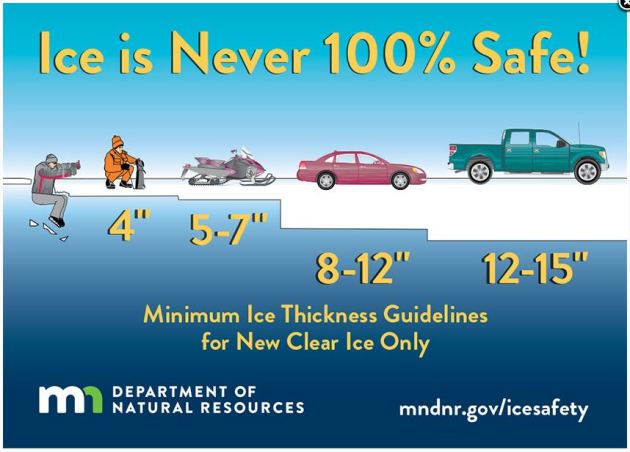
Under 4″ – STAY OFF
4″ – Ice fishing or other activities on foot
5″ – 7″ – Snowmobile or ATV
8″ – 12″ – Car or small pickup
12″ – 15″ – Medium truck
Many factors other than thickness can cause ice to be unsafe.
White ice or “snow ice” is only about half as strong as new clear ice. Double the above thickness guidelines when traveling on white ice.
___________________________________________________________________
.png)
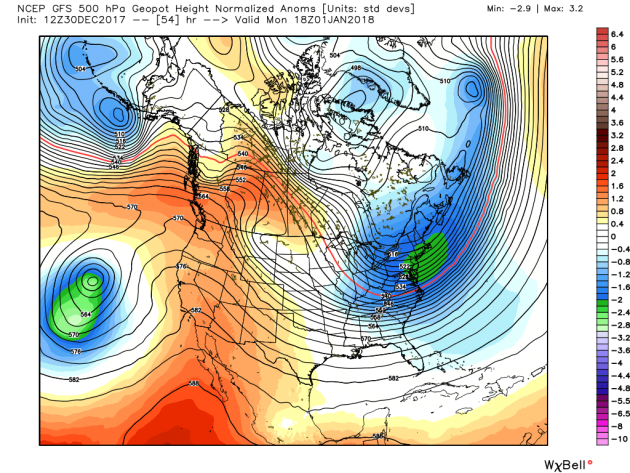
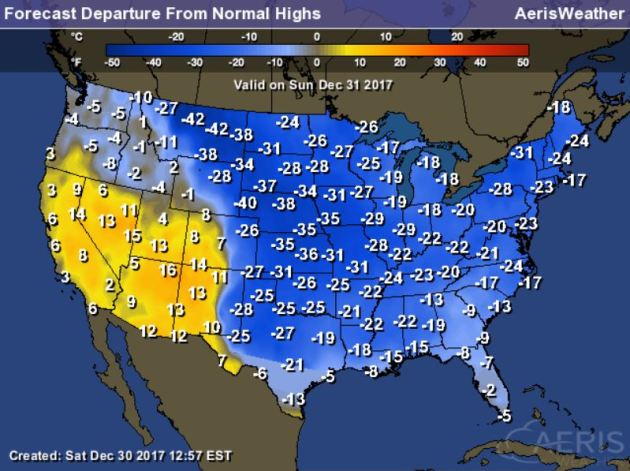
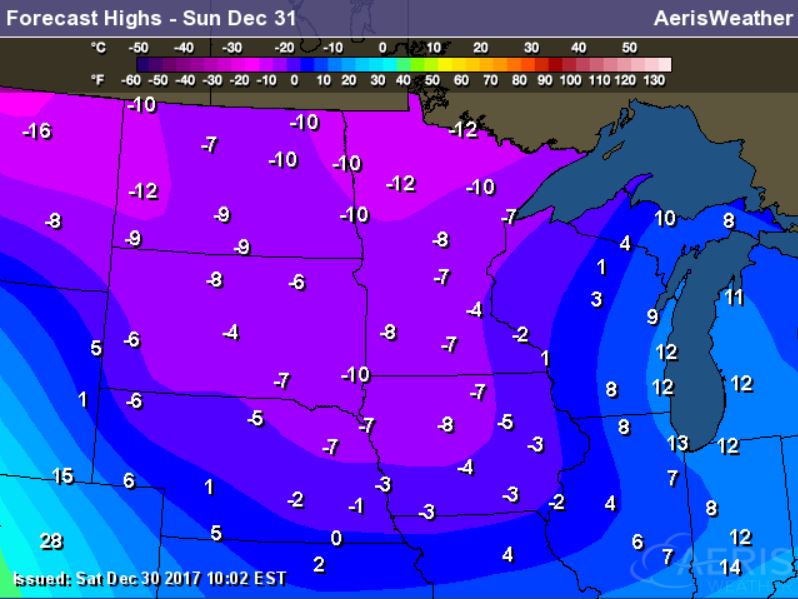
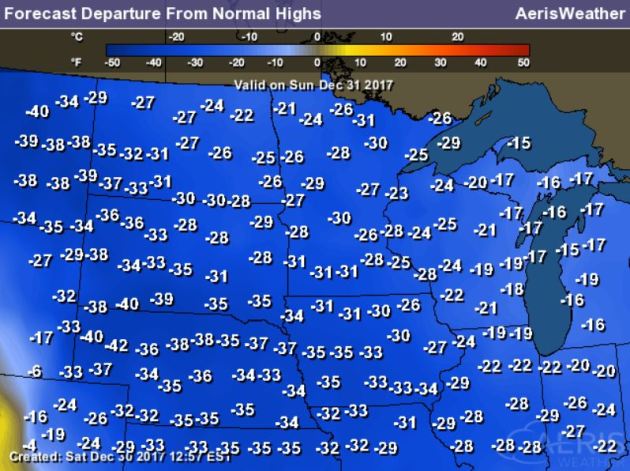
Arctic Air MassArrives
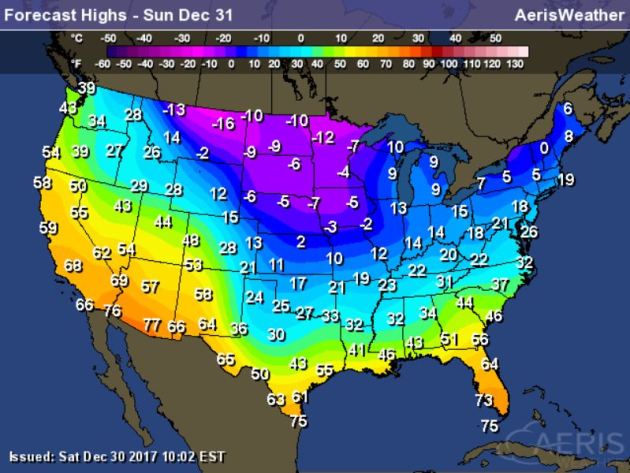
High Temps Sunday
High temperatures on Sunday will still be VERY cold across much of the country with temperatures running nearly 15F to 30F+ below average. Meanwhile, warmer than average temperatures will continue in the southwestern part of the country.
.gif)
According to NOAA’s WPC, the 7 day precipitation outlook suggests areas of heavier precipitation continuing across the West Coast though AM Saturday of next weekend. Parts of northern California could see anywhere from 1″ to 2″+ of liquid. There will also be areas of heavier rain across parts of Florida and even into the Great Lakes.
It certainly has been a fairly active first half of 2017 with 1,522 preliminary tornado reports through December 29th. Note that this is the most tornadoes through that date since 2011, when there were 1,897 reports. The map below shows the distribution of the tornadoes so far this year.
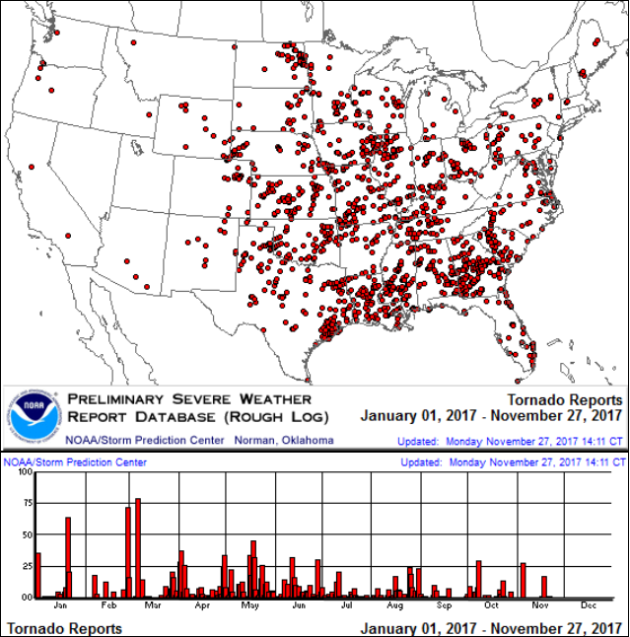
PRELIMINARY 2017 Tornado Count
According to NOAA’s SPC, the PRELIMINARY 2017 tornado count is 1,522 (through December 29th). Note that is the most active year for tornadoes since 2011, when there were 1,897 tornadoes. Notice that the only other year with more tornadoes than this year was in 2008, which ended with a whopping 2,140 tornadoes nationwide.
.png)
_____________________________________________________________________
National Weather Hazards Ahead…
1.) Much below-normal temperatures for most areas east of the Continental Divide, Mon-Wed, Jan 1-3.
2.) Much below-normal temperatures for most of the eastern half of the CONUS, Thu-Fri, Jan 4-5.
3.) Much above-normal temperatures for most of mainland Alaska south of the Brooks Range, Tue-Wed, Jan 2-3.
4.) Heavy precipitation near the south-central Alaska coast, Mon-Tue, Jan 1-2.
5.) Heavy snow downwind of the Great Lakes, Mon-Tue, Jan 1-2.
6.) High winds in southern Alaska, Mon-Tue, Jan 1-2.
7.) Significant waves along part of the south-central Alaska coast, Mon-Tue, Jan 1-2.
8.) Flooding likely in parts of the Pacific Northwest.
9.) Slight risk of much below-normal temperatures for approximately the eastern half of the CONUS, Sat-Sun, Jan 6-7.
10.) Moderate risk of much below-normal temperatures from approximately the Mississippi River eastward to the Atlantic Coast, Sat-Sun, Jan 6-7.
11.) High risk of much below-normal temperatures in the general vicinity of the Lower Great Lakes region, and in the Carolinas and eastern Georgia, Sat Jan 6.
12.) Slight risk of much below-normal temperatures for the northern Great Plains, Tue-Wed, Jan 9-10.
13.) Slight risk of heavy precipitation from central and southern California eastward to the central and southern Rockies, Sat-Mon, Jan 6-8.
14.) Moderate risk of heavy precipitation for southern California, southern Nevada, and Arizona including the vicinity of the Four Corners region, Sat-Mon, Jan 6-8.
15.) Severe Drought across the Great Plains, the Southwest, the Middle and Lower Mississippi Valley, and Hawaii.
.png)
_____________________________________________________________________
Probably The Coldest New Year’s Eve Since 1973
By Paul Douglas
Let’s review: in spite of what The Weather Channel is trying to sell you – we don’t experience storms with names. No hurricanes, coastal flooding, earthquakes, volcanoes or tsunamis. That’s a good start.
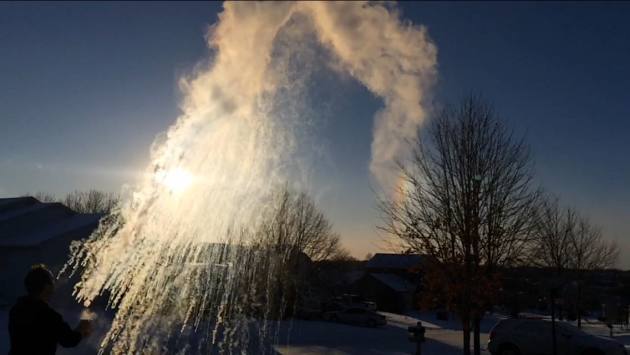
We do enjoy occasional cleansing slaps of Siberian air – the rough equivalent of bathing in sweet-smelling battery acid. Squeaky snow underfoot and ice crystals up your nose sure indicators of subzero fun! What does it feel like? Pluto. How do we live here? Extra layers and a well-preserved sense of humor.
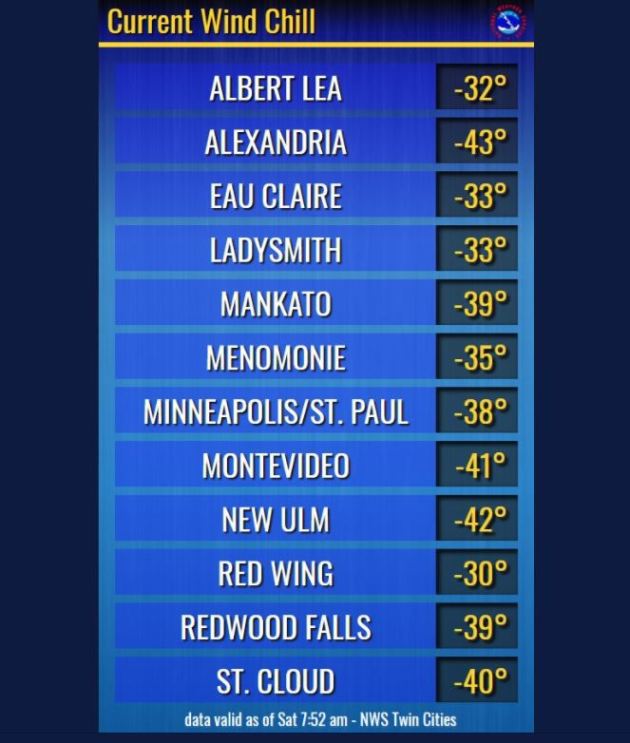
Speaking of superlatives if Sunday stays colder than -2F it’ll be the coldest New Year’s Eve since 1973. By some reports this is the coldest weekend since 1994. Take a winter survival kit along to your party Sunday night, just in case.
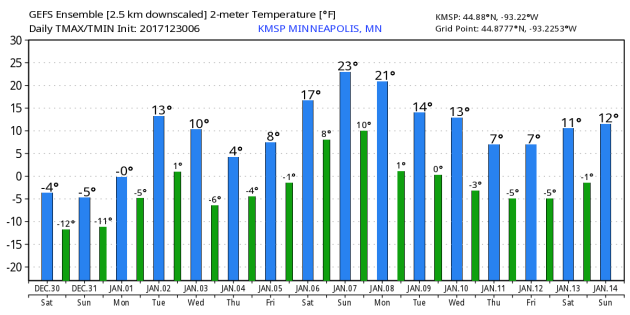
The mercury rises above 0F Monday; a few days in the teens next week. ECMWF guidance is predicting 23F next Saturday. Above zero!
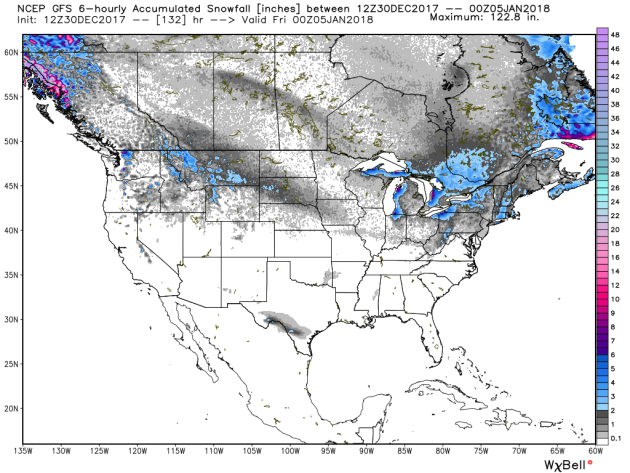
Ice is thickening up on area lakes but the pattern still isn’t ripe for serious snow anytime soon. What little is in your yard won’t melt anytime soon. NOAA climate models predict a milder than normal January. Uh huh.
________________________________________________________________________
Extended Forecast
SUNDAY: Herd-thinning cold. Wind chill -30. Winds: NW 7-12. Wake-up: -17. High: -4.
SUNDAY NIGHT: Mostly clear and cold. Wind chill -25F. Winds: WNW 5. Low: -13.
MONDAY: Blue sky. Numbing start to 2018. Winds: NW 7-12. High: 3
TUESDAY: Clouds increase. Flurries late? Winds: SW 10-15. Wake-up: -7. High: 13.
WEDNESDAY: Another shot. Feels like -20F. Winds: NW 8-13. Wake-up: 2. High: 6.
THURSDAY: Blue sky, light wind. Winds: NW 5-10. Wake-up: -9. High: 7.
FRIDAY: Patchy clouds, still a bit nippy. Winds: S 3-8. Wake-up: -8. High: 8
SATURDAY: Peeks of sun, almost tolerable again. Winds: SW 5-10. Wake-up: 5. High: 22.
_______________________________________________________
This Day in Weather History
December 31st
1999: It’s a balmy end to the 2nd millennium over Minnesota, with temperatures in the 30s over central and southern Minnesota near midnight.
1937: Damage is done by a flood at Grand Marais, while 18 inches of snow is dumped on Grand Portage.
1913: New Ulm has its fortieth consecutive day without precipitation.
_______________________________________________________
Average High/Low for Minneapolis
December 31st
Average High: 24F (Record: 50F set in 1904)
Average Low: 9F (Record: -24F set in 1973)
Record Rainfall: 0.98″ set in 2006
Record Snowfall: 7.2″ set in 1977
_________________________________________________________
Sunrise/Sunset Times for Minneapolis
December 31st
Sunrise: 7:51am
Sunset: 4:42pm
Hours of Daylight: ~8 hours 50 mins
Daylight GAINED since yesterday: ~46 seconds
Daylight GAINED since winter solstice (December 21st): 4 minute
__________________________________________________________
Moon Phase for December 31st at Midnight
0.8 Days Until Full “Wolf” Moon
“Amid the bitter cold and deep snows of midwinter, the wolf packs howled hungrily outside Native American villages. It was also known as the Old Moon or the Moon After Yule. Some tribes called it the Full Snow Moon.”
The moon reaches fullness at 9:24 p.m. EST and will arrive at perigee (its closest point to Earth in its orbit) about 4.5 hours earlier, at 5:00 p.m. EST, at a distance of 221,559 miles (356,565 kilometers) from Earth. (A full moon that takes place during perigee is sometimes known as a supermoon.) Because the full moon coincides with perigee, it will appear to be the biggest full moon of 2018. In addition, very high ocean tides can be expected during the two or three days after peak fullness.
_________________________
High temps on Sunday will still be quite cold across much of the region with readings still nearly -20F to -30F below average! Make sure you bundle up if you are heading to any New Year’s Eve parties… it’ll feel more like -25F as we ring in the New Year!
Here’s the temperature outlook through the 2nd week of January, which suggests colder than average temperatures sticking around much of the Upper Midwest.
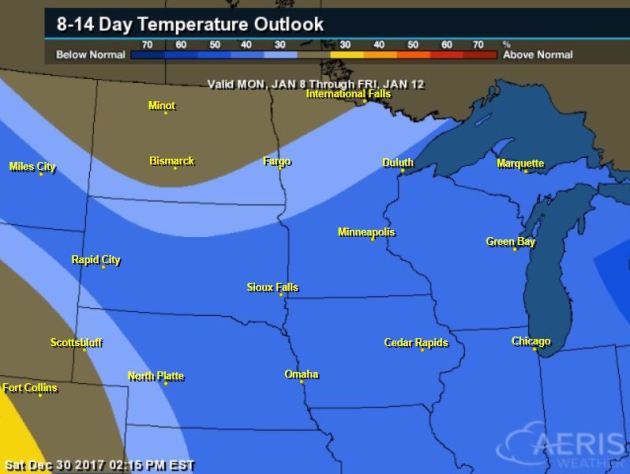
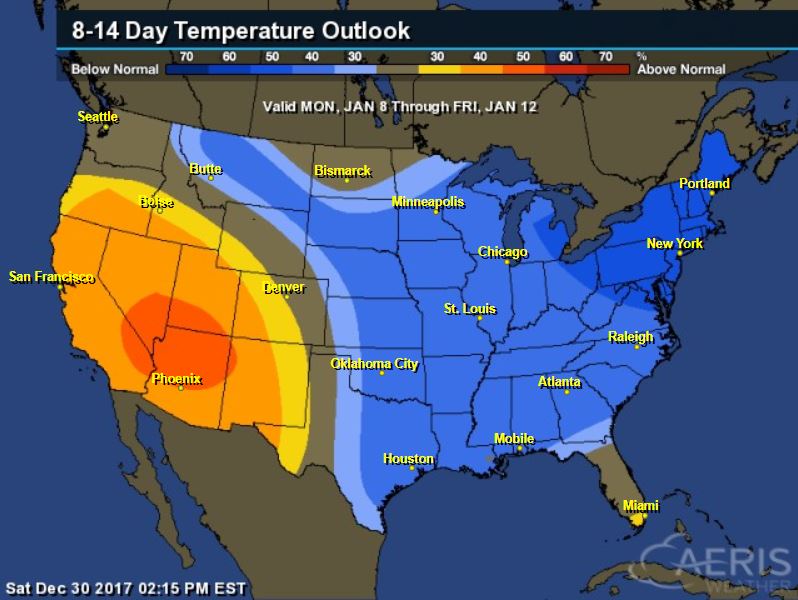
8 to 14 Day Temperature Outlook
Here’s the extended temperature outlook from January 8th to January 12th, which suggests colder than average temperatures sticking around through much of the eastern half of the nation, while warmer than average weather will be found in the Western US.
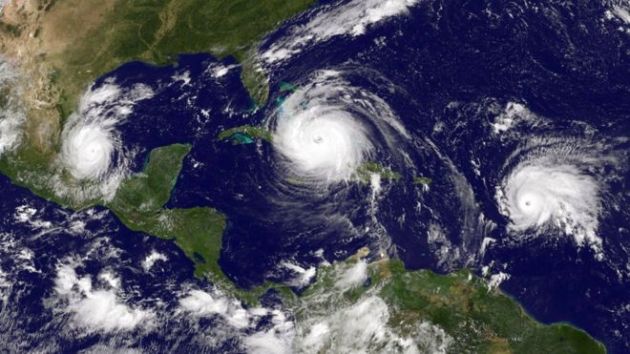
“The past year has been a busy one for hurricanes. There were 17 named storms in 2017, 10 hurricanes and six major hurricanes (category 3 or higher) – an above average year in each respect. The 10 hurricanes formed consecutively, without weaker tropical storms interrupting the sequence. The only other time this has been recorded was in 1893. Are these storms getting worse? And does climate change have anything to do with it? A year of records This Atlantic hurricane season has been particularly bad. There was Harvey, which pummelled the United States in August. It brought the largest amount of rain on record from any tropical system – 1,539mm. It caused the sort of flooding you’d expect to see once every 500 years, causing $200bn of damage to Houston, Texas. Ironically, this was the third such “one every 500 years” flood Houston had suffered in three years.”
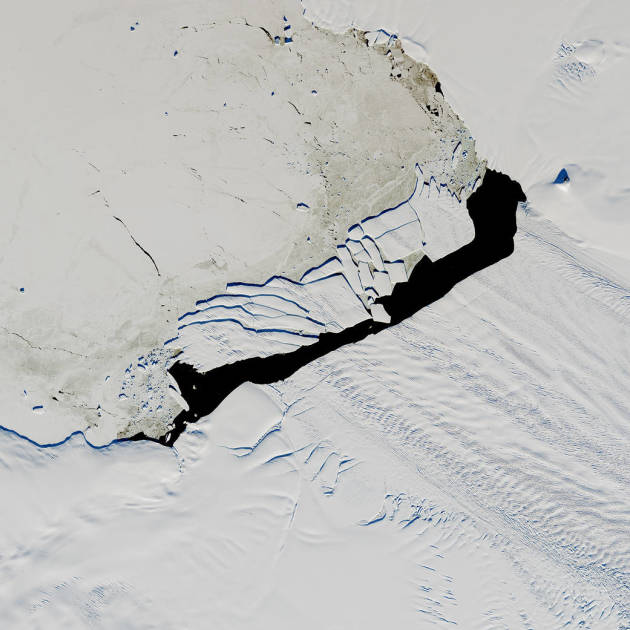
_____________________________________________________________________________“Under the Midnight Sun”
“In September 2017, a new iceberg calved from Pine Island Glacier—one of the main outlets where the West Antarctic Ice Sheet flows into the ocean. Just weeks later, the berg named B-44 shattered into more than 20 fragments. On December 15, 2017, the Landsat 8 Earth-orbitng satellite took this image of the broken berg. An area of relatively warm water, known as a polyna, has kept the water ice free between the iceberg chunks and the glacier front. The polynya’s warm water could have caused the rapid breakup of B-44. This image was acquired near midnight local time. Based on parameters including the azimuth of the Sun and its elevation above the horizon, as well as the length of the shadows, it is estimated that the iceberg rises about 49 meters above the water line. That would put the total thickness of the berg—above and below the water surface—at about 315 meters.”
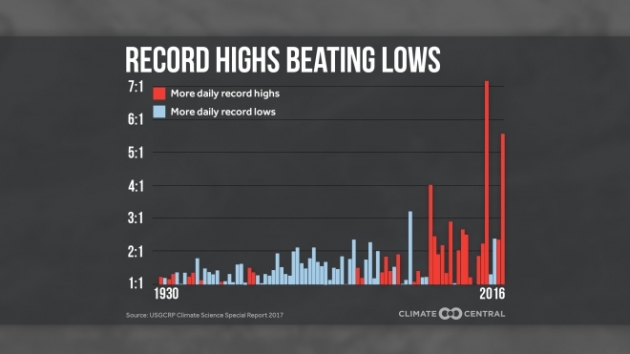
_________________________________________________________________________“Daily Record Highs are Dramatically Outpacing Daily Record Lows”
“Daily record highs are vastly outpacing daily record lows in the U.S. We will always have warm years and cold years, but in a world without global warming, those warm and cold years would balance over time. However, that’s not what we are seeing. According to the 2017 U.S. Climate Science Special Report, after a rigorous reanalysis of GHCN stations back to 1930, 15 of the last 20 years had more daily record highs than daily record lows. The number of daily record highs outpaced daily record lows more than 4 to 1 in 1998, 2012, and 2016. A first look at the data from NOAA/NCEI indicates that 2017 continues the warming trend, as daily record highs are beating daily record lows by a 3.5-to-1 margin so far. Below are some preliminary 2017 stats through the end of November. Visit the NOAA Daily Weather Records tool to get the daily updates on these numbers: Monthly record highs have outnumbered monthly record lows at a rate of 9.7 to 1.All-time record highs have outnumbered all-time record lows 8.7 to 1. Record high minimum temperatures have outnumbered record low minimums 4.6 to 1″
See more from Climate Central HERE:
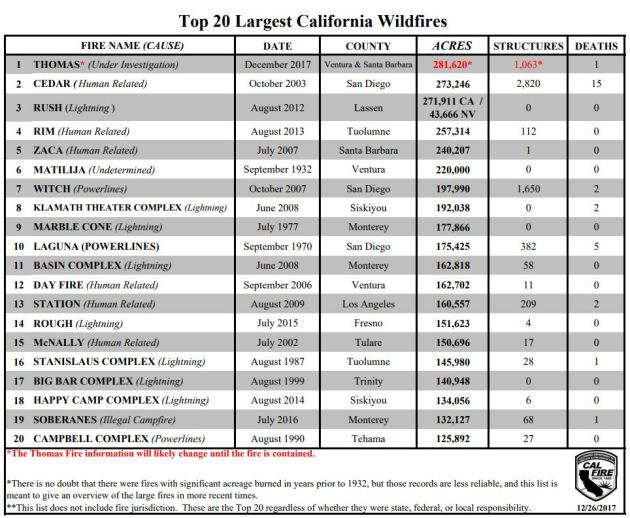
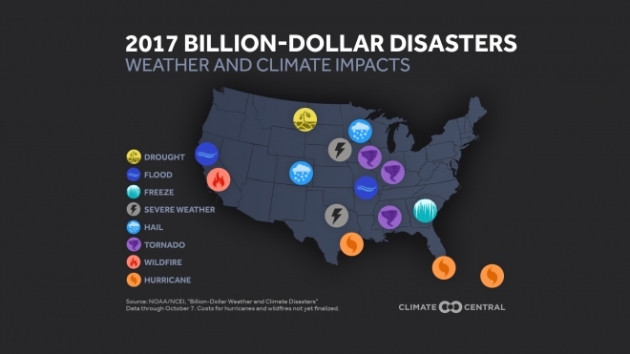
______________________________________________________________________________“The Number and Cost of Weather Disasters is Increasing in the U.S.”
Climate change is increasing the trend in weather and climate extremes in the U.S. A NOAA/NCEI report indicates that through September, the U.S. has had 15 individual billion-dollar weather disasters in 2017. Only 2011 had more billion-dollar disasters with 16, and that was through the entire year. Even without the final calculations from Harvey, Irma and Maria, the total cost is for 2017 about $25 billion, which is far behind the costliest year, 2005 ($215 billion). Rather than one type of event focused on one part of the country, this year’s disasters were spread over several regions. Climate change may have worsened some of the events this year, including drought in the northern Plains and wildfires in the West. In a warming world, soils dry out more from evaporation, making droughts worse and further drying out vegetation, which is susceptible to wildfires. Higher evaporation rates also provide more fuel for hurricanes, allowing them to produce heavier rain. The warming oceans and glacial melt cause the sea level to rise, which translates into a storm surge that is higher and pushes farther inland.”
See more from Climate Central HERE:
____________________________________________________________________________
Thanks for checking in and don’t forget to follow me on Twitter @TNelsonWX