
Wintry Perspective
By any objective measure meteorological winter was extraordinary. It was the 9th coldest for the Twin Cities, but NOAA NCDC reports the 6th coldest winter for Minnesota, 5th coldest for Wisconsin. 18 mornings with Windchill Advisories, the most since 1996.
The Minnesota DNR has an update on the WMI, the Winter Misery Index, factoring extreme cold and snow. This winter rates a 198 score, just 4 points away from qualifying as “Very Severe”; the harshest winter since 1983-84. Details below. Have a nice day.
Yeah, we’re REALLY earning our spring this year.
We cool off later today, a chilly weekend on tap with temperatures 10-15F colder than average. Milder air returns Monday; the lowest mile of the atmosphere may be warm enough for a rain/snow mix by Tuesday. You remember rain, right?
Other than that our pattern looks fairly quiet – a cool, dry bias looking out 10 days.
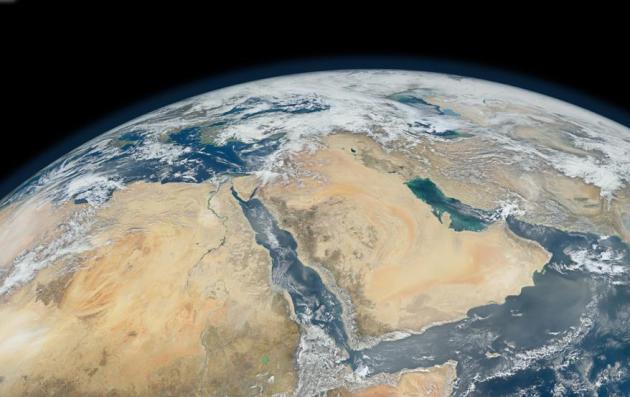
In today’s blog (below) NOAA reports 20 storms in the North Atlantic with hurricane-force winds since January 1, a total of 43 super-storms since October 25, 2013.
NOAA’s 45 day CFS (Climate Forecast System) model shows consistent 60s by the third week of April here in the MSP metro, but I wouldn’t hold my breath. Not yet.
Personally I suspect spring will come on a Thursday.
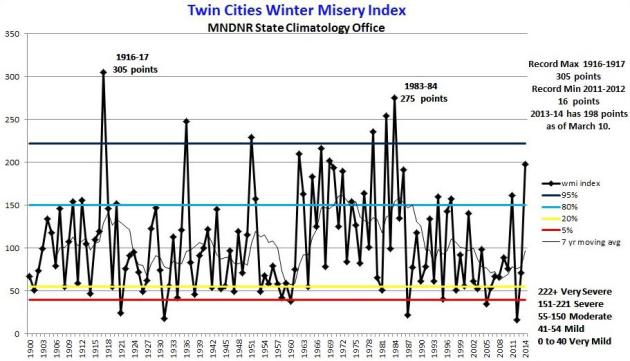
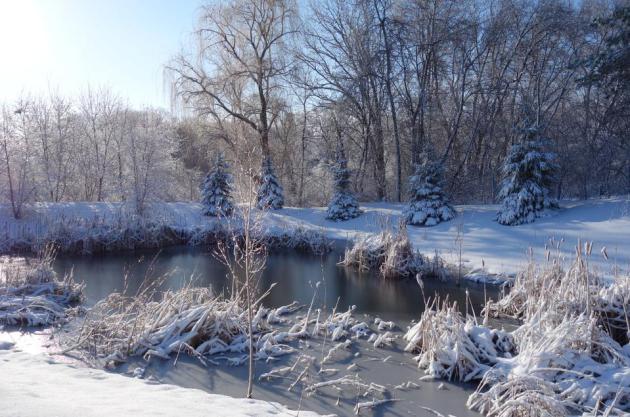
Almost A “Very Severe” Winter In The Twin Cities. Almost? For most of us it was, in fact, very severe. If you examine cold and snow (together) you can make a strong case that this past meteorological winter was the toughest since 1983-1984. The Minnesota DNR has a good summary of the WMI, the Winter Misery Index, and how this winter ranks: “The Winter Misery Index (WMI) is an attempt to weigh the relative severity of winters. The index assigns points for daily counts of maximum temperatures 10 degrees or colder and daily minimums of 0 or colder. If the minimum temperature is -20 or colder greater weight is assigned to the value times 8. For snowfall, one inch is assigned a point per calendar day. A four inch snowfall is times 4, and an 8 inch snowfall is times 16. The duration of a winter is noted by the number of days the snow depth is 12 inches or greater. All current measurements are at the Twin Cities International Airport. So far as of March 10, 2014 the WMI for the winter of 2013-14 in Twin Cities is 198 points, or in the “severe winter” category. The lowest WMI score was the winter of 2011-2012 with 16 points. The most severe winter is 1916-1917 with 305 WMI points…”
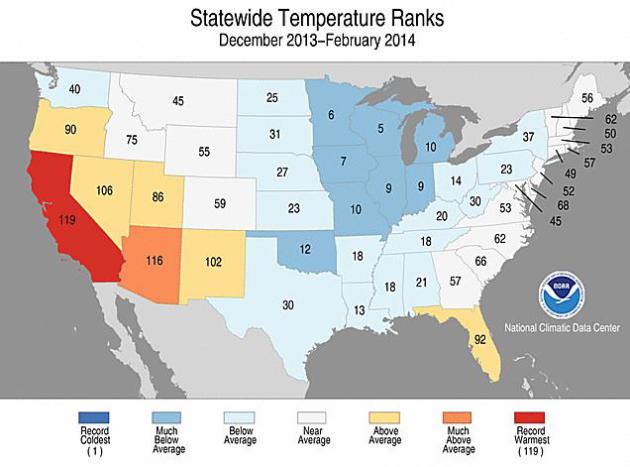
6th Coldest Meteorological Winter For Minnesota. Here are the standings, based on data from NOAA NCDC, for meteorological winter (December 1 through February 28). Wisconsin saw the 5th coldest winter in 119 years, while California experienced the warmest winter on record. The lower 48 states experienced an average temperature of 31.3F, 1F colder than average.
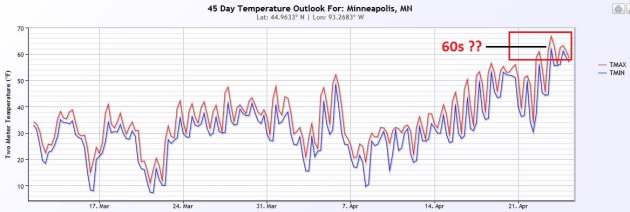
45-Day Wish-Cast. Here is the latest CFS (Climate Forecast System) model output showing temperature trends for MSP into late April; hinting at 60s after April 22-23. Uh huh. Place your bets. Graphic: Ham Weather.
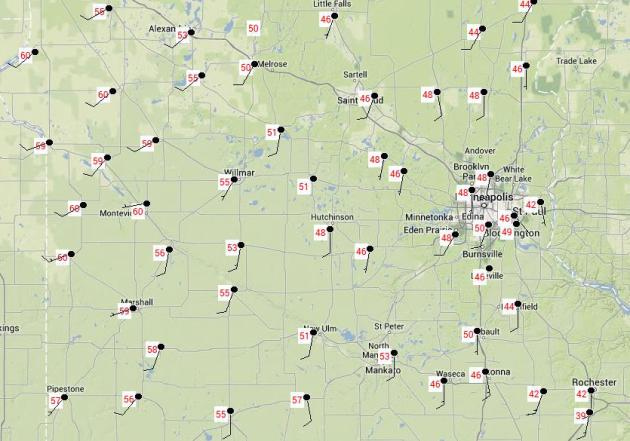
Flirting With 60. There’s no (significant) snow on the ground over far western and southwestern Minnesota; and the mercury took off Thursday, brushing 60F from Pipestone to Canby and Morris. Thursday highs: MesoWest.
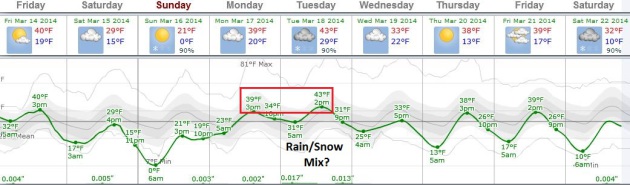
ECMWF Guidance. Next week won’t win any awards for beauty and splendor, but I don’t see anything Arctic either. After a chilly weekend temperatures moderate Monday and Tuesday, when a storm may push in with a rain/snow mix. It’s too early to speculate on amounts, but I don’t think this next system will have moisture to work with from the Gulf of Mexico. With temperatures above freezing any snow would be wet and slushy, maybe a few inches of mush for central Minnesota. Graphic: Weatherspark.
A Fickle Thaw. Much of America east of the Rockies will see a warming trend into Friday, but Canadian air leaks south of the border again over the weekend from the Upper Mississippi Valley into the Great Lakes and New England. Spring is always two steps forward, one step back. Or is it the other way around? 2 meter NAM temperature forecast: NOAA and Ham Weather.
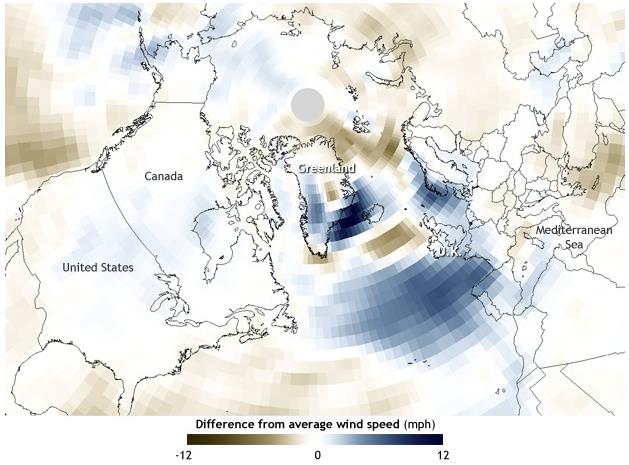
Winter of 2013-14 Already Tops 2012-13 For Number of Hurricane-Force Storms in North Atlantic. Tell that to residents of Britain, where they just had the wettest winter in at least 250 years of record-keeping. NOAA’s climate.gov has the story; here’s an excerpt: “…According to NOAA’s Ocean Prediction Center, 20 separate hurricane-force wind events occurred during January through February alone, and 14 of them had low-pressure centers that underwent the rapid intensification that meteorologists call bombogenesis, in which the storm’s central pressure drops by at least 24 hPa in a 24-hour period. In addition, 8 of the low centers had a central pressure below 950 hPa. Between October 25, 2013, when the first hurricane-force event of the season occurred, and March 8, when the most recent one to date occurred, 43 unique hurricane-force events have blasted their way across the North Atlantic. Thirty of them underwent rapid intensification. The most intense system occurred on December 24, 2013; pressure in the heart of the storm dropped to 929 hPa as the storm lurked north and northwest of the British Isles…”
More Whiplash: Ice Storm To Severe Storms In Less Than A Week. Not a great year to be a tree in the Carolinas, where the atmosphere can’t quite make up its mind whether it’s winter or spring. Many cities from St. Louis to Philadelphia reported near-record 30-45 degree temperature drops in less than 24 hours earlier this week; the subject of today’s Climate Matters: “WeatherNationTV Chief Meteorologist Paul Douglas goes over the huge temp swings associated with this latest winter storm. High winds and multiple ice storms led to power outages in Washington DC and downed trees in North Carolina. And all the snow! More places are creeping near their snowiest winters on record. Here’s to hoping we don’t miss Spring!”

Drought Blamed For Rising Food Prices. Will the symptoms of a deepening drought in California show up soon in Minnesota grocery stores? Here’s a video and article excerpt from KGO-TV, ABC 7 in the San Francisco Bay Area: “Some of the first effects of the drought in California are starting to be seen in grocery stores as prices at Bay Area market begin to rise. In many cases, consumers are only getting half the food for the same price they paid before the drought. The price of beef alone has doubled ever since ranchers began selling off their herds because of the lack of grass...”
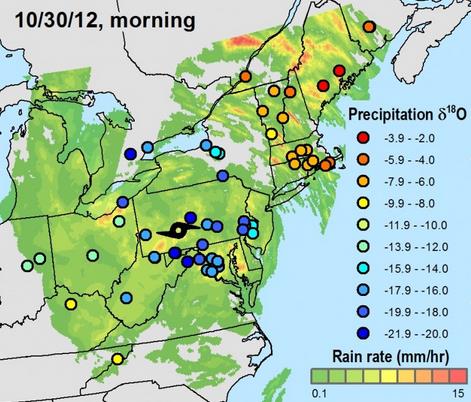
Hurricane Rainwater Samples Map Sandy’s Evolution. No, all rains are not created equal. Here’s a unique example of crowd-sourcing and how rain with slightly different isotopes was used to track Sandy’s arrival in late October of 2012; an excerpt from Claims Journal: “…Sandy left a distinctive isotopic signature in rain collected from the mid-Atlantic up into in New England that shows how a dry cold front originating out of the Midwest joined with Sandy – which developed from a tropical wave over warm water in the Caribbean – and likely prolonged and expanded the storm,” says Bowen. The sampling technique provides a new way of studying how these “extra-tropical” hurricanes interact with the weather systems of the northern latitudes, and thereby aids in hurricane forecasting and analysis…”
Image credit above: “Snapshot of rainfall and oxygen-18 isotope values using crowdsourced rainwater samples collected during landfall of Superstorm Sandy.” Chart: Gabe Bowen, University of Utah.
Here are a few not-so-fun scenarios to consider. Remember, it’s the unknown unknowns that often come back to bite you:
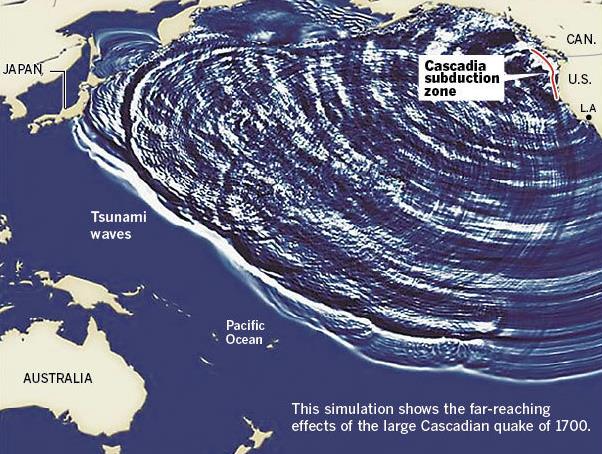
A Cascadia Quake Could Devastate. The Los Angeles Times has an interesting article and infographic that explains the nagging risk of earthquakes and resulting tsunamis, and not from the San Andreas fault; here’s an excerpt: “…The Cascadia zone extends 700 miles along the coast from near Eureka, Calif., to Vancouver, Canada, and is capable of producing a catastrophic 9.0 earthquake and tsunami, as happened Jan. 26, 1700. A graphic below shows the tsunami that likely was produced by the large-magnitude quake more than 300 years ago and caused damage as far away as Japan. Shown here is how this subduction zone creates such large quakes and tsunamis...”
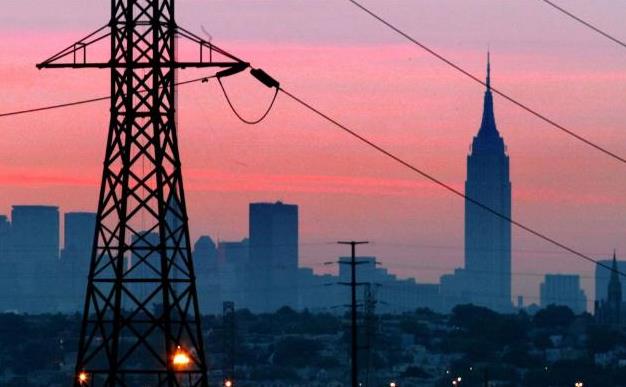
Power Grid Preparedness Falls Short, Report Says. With a little luck we won’t soon experience a G4 or GF geomagentic storm, triggered by a CME, a mass coronal ejection of charged particles from the sun. It happens on a fairly routine basis, we’ve just been relatively lucky here on Earth since the mid 1800s. How long will our luck hold out? Here’s an excerpt of a recent New York Times story: “Nearly all the utilities that participated in two-day exercise last November to test the preparedness of the power grid for online and physical attacks said that their planning was not good enough, according to a report by the North American Electric Reliability Corporation, which organized the drill. But the participants, more than 2,000 of them from across the United States, Canada and Mexico, said the exercise taught them lessons about whom they would need to communicate with in an attack, and where their vulnerabilities were…”
File photo above: Associated Press.
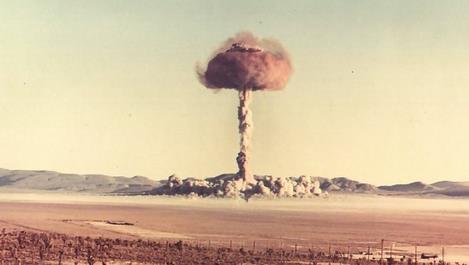
How To Survive A Nuclear Bomb: An Update On “Duck And Cover”. Some of you may be old enough to remember the Duck and Cover drills in schools back in the 50s and 60s, at the height of the Cold War. This is a subject none of us want to consider, but in the unlikely event you’re ever confronted with a small, thermonuclear explosion, there are steps you can take you increase the odds of survival. Here’s an excerpt from a long, vaguely horrific article at Gizmag: “If it would take you less than five minutes to reach adequate shelter, go there immediately following the immediate blast effects. In the end, the better shelter will offset your brief exposure to higher levels of radiation. If adequate shelter is less than 15 minutes away, shelter in place for no more than 30 minutes, then transfer to the better shelter. Again, the combination of a short period of immediate shelter combined with a move to better shelter will offset your exposure during the move (at least statistically)…”
Image credit above: “US Atomic Energy Commission 14 kT Bunker Charlie test – October 30, 1951.” (Photo: USAEC).
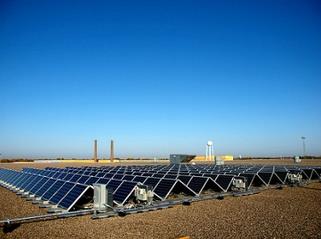
Minnesota Becomes First State To Set “Value Of Solar” Tariff. Do you have solar panels on your rooftop yet? Odds are, over the next few years, as solar prices continue to drop, many of us will consider tapping free energy from the sun. Midwest Energy News has an article that caught my eye – here’s the introduction: “Minnesota utility regulators on Wednesday approved the nation’s first statewide formula for calculating the value of customer-generated solar power. The Minnesota Public Utilities Commission voted 3-2 in favor of a proposal aimed at settling the perennial debate over how much solar power is worth to a utility and its ratepayers, as well as society and the environment…”
Photo credit above: “A rooftop solar installation in Minneapolis.” (Photo by Minnesota Solar Challenge via Creative Commons).

Here’s What The Future Of Car Navigation Looks Like. Digital distractions, or helpful visual aids? We’ll see. Quartz has a good article on the future of man-vehicle interfaces; here’s a clip: “…Carmakers have been experimenting with head-up displays (HUD) in cars since the late 1990s. But early efforts have been cautious, displaying only speed and other basic information near the bottom of the windscreen. New technologies allow them to be bolder: the authors see HUD, long used by fighter pilots, as becoming a natural part of looking through the windshield, and, in some cases, being embedded on real-world objects such as the road or buildings. It is Borges’s 1:1 map come to life. Indeed, BMW already has a prototype AR windshield that overlays information onto the road surface to indicate upcoming turns…”
Image credit above: “How on-screen or wearable augmented reality can work in either “screen-fixed” or “world-fixed” modes, compared to in-car devices.” Proceedings of the IEEE.

The Unhealthy Meat Market. I have no plans of going vegan anytime soon, but this Op-Ed from Nicholas Kristof at The New York Times made me stop and think; here’s an excerpt: “…Leonard’s book argues that a handful of companies, led by Tyson, control our meat industry in ways that raise concerns about the impact on animals and humans alike, while tearing at the fabric of rural America. Many chicken farmers don’t even own the chickens they raise or know what’s in the feed. They just raise the poultry on contract for Tyson, and many struggle to make a living…”
50 F. high yesterday in the Twin Cities.
40 F. average high on March 13.
33 F. high on March 13, 2013.
10″ snow on the ground as of Thursday evening.
TODAY: More cloud than sun, cooler breeze. Winds: NW 10-20+ High: 40 (falling through the 30s)
FRIDAY NIGHT: Partly cloudy and colder. Low: 19
SATURDAY: Clipper potential. Coating of flakes. Few inches southeastern MN? High: 29
SUNDAY: Partly sunny, still chilly. Wake-up: 4. High: 25
MONDAY: Patchy clouds, a bit milder. Wake-up: 21. High: 39
TUESDAY: Rain/snow mix MSP. Snow north. Wake-up: 30. High: 42
WEDNESDAY: Damp start, slow clearing. Cooler. Wake-up: 25. High: 34
THURSDAY: Cloud-cluttered. No tulips yet. Wake-up: 17. High: 38
Climate Stories….
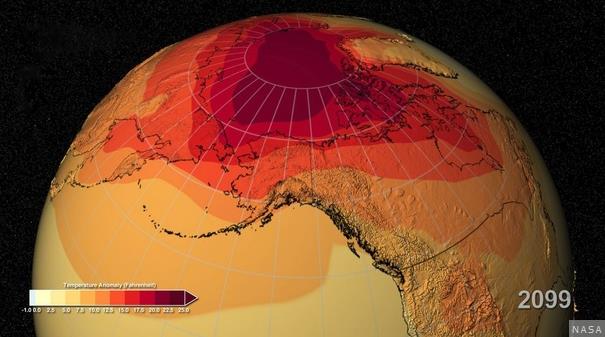
Don’t Get Used To The Idea Of A Global Warming “Slowdown”. The Atlantic Cities has the latest findings on climate sensitivity; here’s a clip: “…But “too warm” is a concept we need to wrap our soon-to-be-baked brains around, according to new research from NASA’s Drew Shindell. After performing a region-specific analysis of the things that affect the global climate, Shindell has come to the conclusion that, slowdown be damned, we are still looking at a vast leap in the earth’s heat levels. In fact, there could be a warming increase about 20 percent greater than indicated by surface-temperature observations from the last 150 years, according to his new study in Nature Climate Change…” (Image: NASA).
Earth To Get Hotter Despite Global Warming Slowdown. It seems like a contradiction at first blush, but 90% of the additional heat is going into the world’s oceans – how that warmth and energy will ultimately manifest itself is a big unknown. Here’s an excerpt from The Economic Times: “…Drew Shindell, a climatologist at NASA’s Goddard Institute for Space Studies in New York, found Earth is likely to experience roughly 20 per cent more warming than estimates that were largely based on surface temperature observations during the last 150 years. Global temperatures have increased at a rate of .12 degrees Celsius per decade since 1951, researchers said…” (Image: NASA).
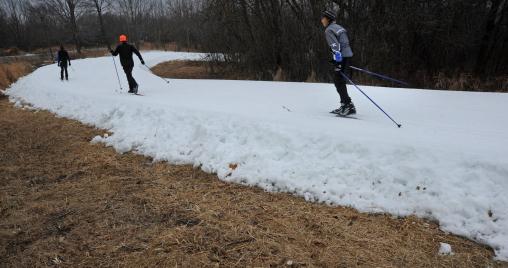
Snow Trax: Climate Change Puts Snow Sports In Jeopardy. Here’s an excerpt from a story at the Sante Fe New Mexican: “…In a new book by veteran ski journalist Porter Fox, DEEP: The Story of Skiing and the Future of Snow, he reports, “The snowpack in British Columbia has declined by half overall and the ski season in some regions is four to five months shorter than it was 50 years ago. Eastern Canada is even warmer … Computer models show the Northeast ski season shrinking to less than 100 days by 2039. Under other models, the mean snow depth for the Rocky Mountains is predicted to drop to zero by 2100.” In the Alps, where “temperatures are rising three times faster than the global average,” he notes, the infrastructures of the high alpine (refuges, chairlifts, antennas, etc.) are built on permafrost and without reinforcements are likely to crumble as permafrost melts…” (File photo: Star Tribune).
