79 F. high in the Twin Cities Saturday.
84 F. average high on July 19.
86 F. high on July 19, 2013.
July 19 in Minnesota Weather History:
1951: Tornado hits Minneapolis and Richfield killing five.
1909: 10.75 inches of rain fell in 24 hours at Beaulieu in Mahnomen County. This record would stand for over 50 years. Bagley received an estimated 10 inches.

Monday Hot Front
The weather has always been extreme. The notion of “average weather” is a statistical pipe-dream; it rarely happens in real life.
But tracking daily weather over the last 40 years I’ve noticed an increase in the frequency and intensity of weather extremes, not just here at home, but worldwide. Insurance companies and the Department of Defense are tracking these same trends; an apparent spike in instability, volatility and weather-whiplash.
Here’s another example: factoring in dew points in the mid-70s and temperatures in mid-90s tomorrow’s heat index could reach 100-105F. An Excessive Heat Watch is posted. That’s one week, to the day, after a miniature vortex of October-like air had Minnesotans reaching for jackets & sweatshirts. From wind chill to heat index in 7 days; a 60 degree jump in apparent “feels-like” temperature? That’s highly unusual for mid-summer.
Expect more sun (and heat) today, the warm-up act for Monday’s scorcher. T-storms Monday night and Tuesday may turn severe; the best chance of hail and damaging winds up north. We cool off by midweek before another warm surge sparks T-storms next Friday.
Tomorrow? A subtle (yet blunt) reminder that summer heat usually peaks in mid-July.
...DANGEROUS COMBINATION OF HEAT AND HUMIDITY POSSIBLE ACROSS THE
TWIN CITIES METRO MONDAY AFTERNOON AND EVENING...

AN EXCESSIVE HEAT WATCH IS IN EFFECT FOR MONDAY AFTERNOON AND
EVENING FOR THE TWIN CITIES METROPOLITAN AREA. HIGH TEMPERATURES
ARE EXPECTED TO REACH THE LOWER 90S MONDAY AFTERNOON. THIS
COMBINED WITH DEW POINTS IN THE MIDDLE 70S WILL RESULT IN HEAT
INDICES REACHING 105 DEGREES. IN ADDITION...IT WILL REMAIN QUITE
WARM MONDAY NIGHT WITH LOWS IN THE MIDDLE 70S.
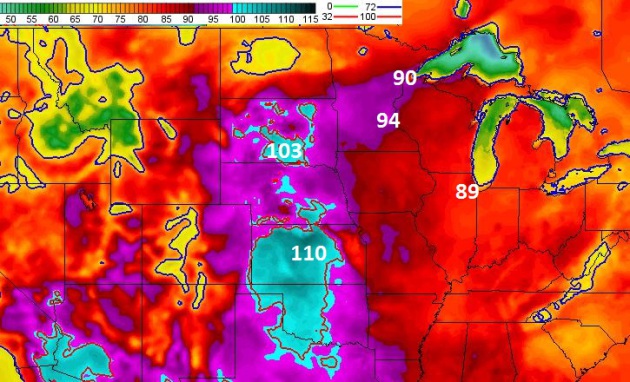
Monday: 4 PM Predicted Temperatures. NOAA’s NAM model predicts highs in the mid-90s in the Twin Cities metro, some upper 90s possible over far west central Minnesota. 100-degree heat is possible from South Dakota across much of the Great Plains. Graphic: HAMweather.
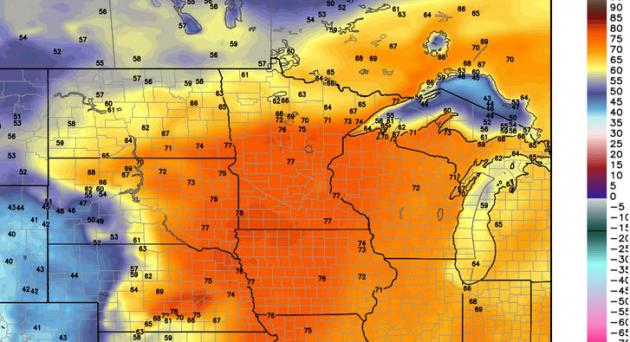
Monday Dew Points. What takes Monday into “Heat Watch” territory is the combination of heat and humidity. NOAA NAM dew point forecasts show readings in the mid to upper 70s. That should make for a heat index in the 100-105F range by mid and late afternoon, increasing the potential for heat exhaustion and heat stroke. Graphic: Weather Bell.
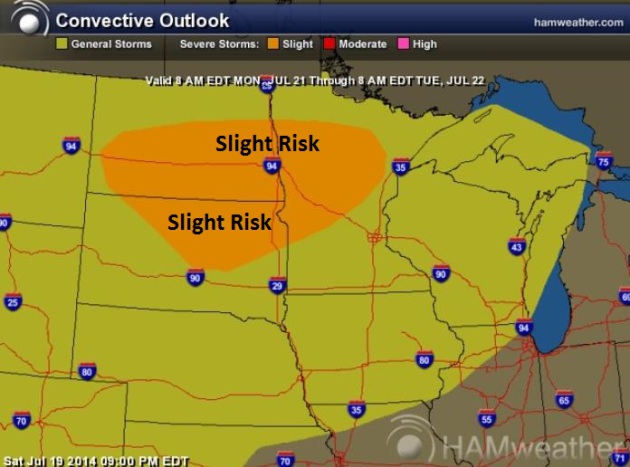
Monday Severe Risk. An MCS (meso-convective) system may bubble up along the leading edge of broiling, tropical air late Monday and Monday night, pushing across central and northern Minnesota, where the severe risk may be greatest Monday night into Tuesday. A few strong T-storms may brush the Twin Cities early Tuesday, but Little Falls, Brainerd and Duluth stand a better chance of hail and damaging winds. Map: NOAA SPC and HAMweather.
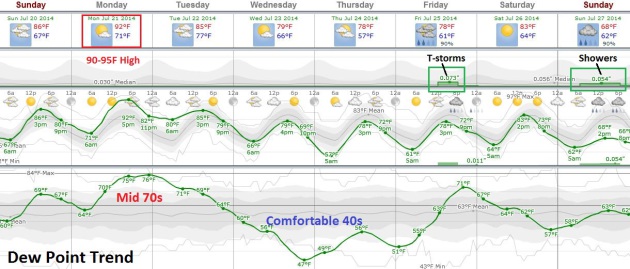
One Uber-Uncomfortable Day, Then Relief. Monday will be a poignant reminder of just how hot (and humid) it can get at this northerly latitude, but after a close call with strong to severe storms Tuesday winds swing around to the north/northeast, pushing much more comfortable air into town by midweek; dew points dropping into the 40s. Another warm front sparks T-storms Friday; right now next Saturday appears to be the better lake day with a small risk of T-storms. A week from Sunday? Don’t ask. Meteogram: Weatherspark.
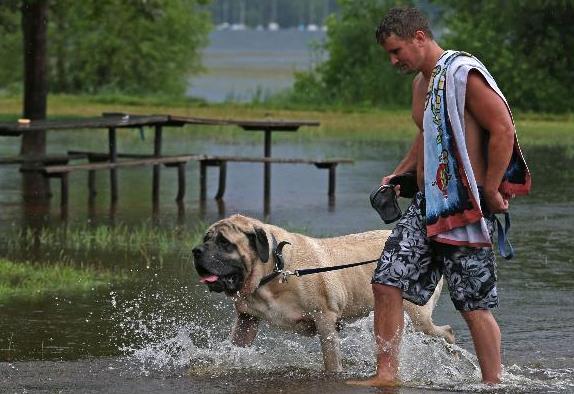
Don’t Count on Another Dry July and August in Minnesota. For the record I agree – the pattern looks drier than June, but that isn’t saying much; I still expect above normal rainfall amounts into much of August. No “flash drought” this summer. Here’s an excerpt from The Star Tribune: “The past three summers have suggested a new weather adage for Minnesota: “In late July, the land gets dry.” Wet springs and early summers have given way to drought anxieties by State Fair time for the past three years. But in 2014, the wettest June on record statewide may have overpowered the budding trend. There’s simply too much water around — in saturated soils and wetlands, in brimful lakes and streams, in the very air itself — to break the rainy cycle, said University of Minnesota Extension meteorologist Mark Seeley…”
Photo credit above: Bruce Bisping, Star Tribune. “Jeff Eagon, of Blaine, and his dog Zeus negotiated a waterlogged patch of ground near Lake Calhoun in Minneapolis last week.”
Record Cool Spell for Mid-July. There was no confirmed frost up north Wednesday morning, but we came very close. Dr. Mark Seeley highlights some of this past week’s weather oddities, specifically the record cool spell that swept southward out of Canada Monday into Wednesday. Here’s a highlight of this week’s Minnesota WeatherTalk: “…The cold air took residence for about 48 hours and brought new record cold mean daily temperatures (average of the maximum and minimum values for the day) to many communities on Tuesday, July 15th. Some of these records include: 55 F at Pipestone; 57 F at Windom; 58 F at Waseca and Grand Meadow; 59 F at Zumbrota, Austin, and Winnebago; and 60 F at Rochester. Finally, clear skies, high pressure, and calm winds brought some record minimum temperature values on Wednesday morning to northern and western parts of Minnesota. Some of the new records included; 35 F at Brimson; 38 F at Hibbing (tied 2007); 39 F at International Falls, Silver Bay, Crane Lake, Eveleth, and Orr; 45 F at Wheaton; and 46 F at Marshall and Worthington…”
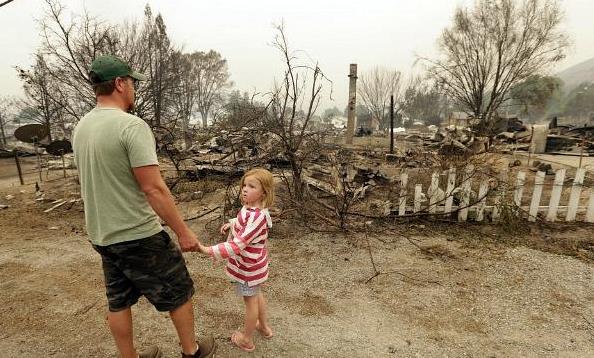
2014 Wildfire Season Worse Than Usual Across the West. Here’s an update from The Christian Science Monitor: “…As of the weekend, there were 32 large active fires, most of those in the Pacific Northwest (18 in Oregon, four in Washington). So far this year, firefighters have had to deal with 30,151 blazes covering a total of 1,146,493 acres, and the forecast is for more of the same, according to the fire center: “Above normal fire potential will persist over much of California, the Northwest and the Great Basin in July…. In August, above normal fire potential will continue over most of California, Nevada, Oregon, Washington and Idaho…”
Photo credit above: “Forrest Harrison with his daughter Avery, 5, looks over the remains of his home. A fire racing through rural north-central Washington destroyed about 100 homes as it blackened hundreds of square miles.” Elaine Thompson/AP.

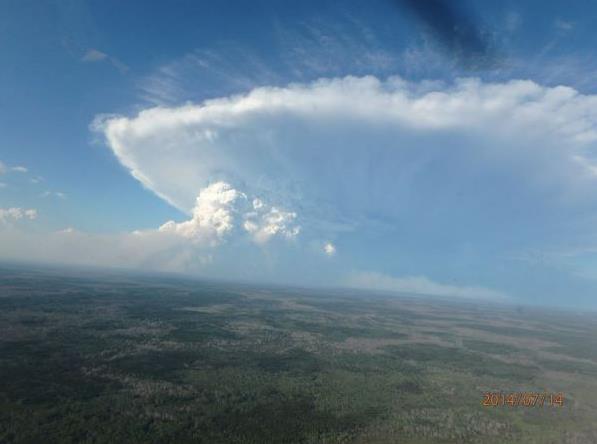
Worst Wildfire Season in Decades in Canada’s Northwest Territories. It’s the source of the milky-white pall of smoke drifting over Minnesota and much of the rest of the USA. Alaska’s Dispatch News has the article; here’s an excerpt that caught my eye: “…According to the Canadian Interagency Forest Fire Center, there have been 31 new fires in the past 24 hours across Canada, over 2,500 so far this year and well over 2.47 million acres burned to date, early in the season. According to Flannigan, in recent years, about 8,000 fires burn about 4.9 million acres of land each year in Canada. That’s about double the annual average of just 40 years ago, he says. Canada’s senior climatologist, Dave Phillips, says the southern Northwest Territories is experiencing the hottest, driest summer in some 50 years...”
Photo credit above: “This Tuesday, July 15, 2014 aerial photo provided by Canada’s Wildfire Management Branch shows the Mount McAllister wildfire in the northeastern region of the British Columbia province of Canada. An evacuation order has been issued for the District of Hudson’s Hope in northeastern British Columbia ahead of the wildfire which is threatening the community of about 1,150 residents.” (AP Photo/The Canadian Press, B.C. Wildfire Management Branch).
Erratic Polar Jet Stream Contributing to Historic Fires Across Canada & Siberia? Robert Scribbler has a very interesting post, focusing on the severity and aerial extent of fires raging unusually far north for July. Is polar amplification, triggered (in theory) by rapid Arctic warming, a factor? Here’s an excerpt: “…According to reports from Canada’s Interagency Fire Center, total acres burned to date are more than six times that of a typical year. A rate of burning that, according to a recent scientific study, is unprecedented not just for this century, but for any period in Canada’s basement forest record over the last 10,000 years...”
Photo credit above: NWT Fire Facebook.
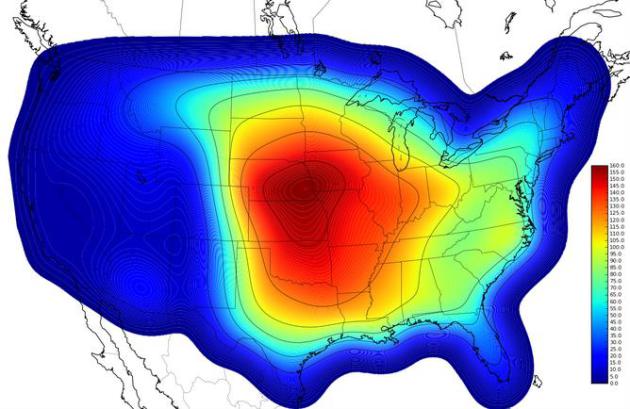
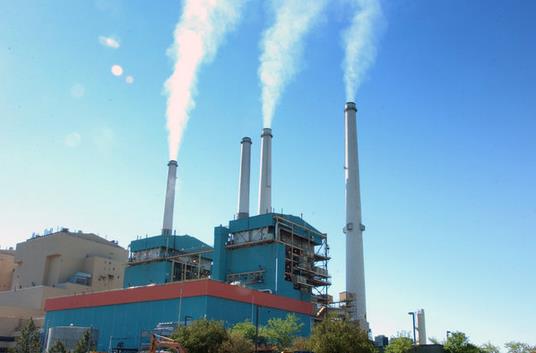
Wind Turbines Could Rule Tornado Alley. Yes, we have the potential wind power to provide a significant percentage of a (revamped) power grid with wind energy from the Great Plains, where winds blow with amazing regularity, with or without tornadoes. Here’s an excerpt of an interesting story at Forbes: “…So wind has become our fifth largest power generator, and will capture fourth place from hydropower before 2030 since we’ve basically tapped out hydro in this country. However, although wind turbines are strewn throughout America, most of this generation is coming from Tornado Alley (Wind Electricity Generation In Tornado Alley; EIA). In the Tornado Alley states of Kansas, South Dakota and Iowa, wind generated 20%, 26% and 27% of the total electricity produced, respectively, and is now the second-largest electricity source in those states (EIA States). Some advantages of putting large numbers of wind turbines in Tornado Alley is they are ideally shaped to withstand extreme winds, they generally displace coal, and they don’t need to be on pristine natural lands…”

Hurricane Season: Beware of this $50 Billion Threat. The Motley Fool has an article that highlights the risk of (inland) flooding. Higher sea levels mean storm surges can push farther inland, threatening areas that aren’t accustomed to hurricane flooding. Here’s a clip: “…Though most homeowners aren’t aware, typical home insurance policies don’t cover damage from flooding. One of the reasons that flooding tops the threat list, over physical damage from hurricanes or tropical storms, is its ability to spread further than a storm’s footprint. While a storm surge (water pushed inland by strong winds) has a huge, direct impact on coastal areas, the same surge can effect areas much further inland. Due to rising sea levels, water levels are already elevated, allowing flooding to spread further than in past years...”

Apps for Hurricane Season. GeekBeat.tv has a good overview of apps and web site resources for people living in Hurricane Alley; here’s a clip: “To get your information straight from the National Weather Service or National Hurricane Center you’ll need a Third Party App like NOAA Now for Android or “MyFoxHurricane” for both iOS and Android which bundles Fox News video along with the National Weather Service maps and information. For Windows Phone users there’s an unofficial Weather.Gov App. It pulls in maps and forecasts from the National Weather Service site. If you’d like to bypass third party apps and still get your information straight from the National Hurricane Center or the National Weather Service, just use the full mobile versions of those sites. They’ll work on any smartphone and are ad-free. Bookmark them today; you’ll thank us later…”
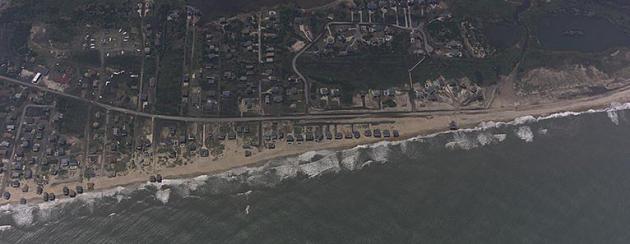
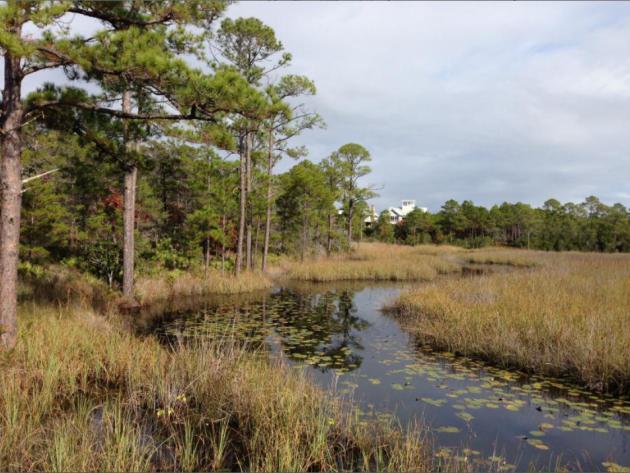
Seeing Things More Clearly. NOAA’s National Ocean Service has a story about how the agency used a new technique for obtaining aerial photographs in the wake of Hurricane Arthur, and why this is a step forward. Here’s an excerpt: “…These missions marked the first time that surveyors collected oblique imagery, or images taken at an angle rather than straight down, in response to a tropical cyclone. The advantage to this type of approach is that it allows the team to photograph a wider area and also improves the visibility of vertical structures, such as the sides of buildings, as opposed to only the tops of buildings as typically seen in traditional imagery. In addition to the photos collected along the coast, the survey team evaluated a GoPro® to collect video during the flight. The goal of this new layered approach in aerial video and photo documentation is to provide and evaluate better visual context that might be missing in vertical photography alone — the sole type of imagery gathered by NOAA surveyors in past missions…”
Photo credit: A New Angle. “Imagery collected by NOAA in the aftermath of Hurricane Arthur tested new photographic techniques that may lead to more comprehensive post-storm surveys in the future. Shown here: the North Carolina coast near Rodanthe shortly after Hurricane Arthur passed through the area.”

Which Colors Do You Smell? I thought this curious article at Huffington Post was worth a mention; here’s an excerpt: “…A group of international researchers, led by Carmel A. Levitan at Occidental College, tested whether our association of colors with smells is universal (hard-wired in our brains) or based on cultural factors like language and frequent association between objects and smells. Previous studies are inconclusive: Some researchers have shown that connections between odors, musical notes, and geometric shapes are hardwired into our brains. But the color-odor connection isn’t always consistent; Canadians consistently associate almond smell with the color red, but in a separate study, Australians smelled blue…”
TODAY: Hot sun, windy. Dew point: 67. Winds: S 15-25. HIgh: 87
SUNDAY NIGHT: Warm and sultry. Low: 72
MONDAY: Excessive Heat Watch. Sunny, dangerously hot. Dew point: 75. Feels like 103F. High: 93
TUESDAY: T-storms likely, some severe up north. Wake-up: 78. High: 88
WEDNESDAY: Sunny and more comfortable. Dew point: 54. Wake-up: 66. High: 79
THURSDAY: Partly sunny, still pleasant. Wake-up: 62. High: 78
FRIDAY: Sticky, a few heavy T-storms. Wake-up: 61. High: 79
SATURDAY: More sun, pop-up PM T-storm? Wake-up: 64. High: 83
Climate Stories….
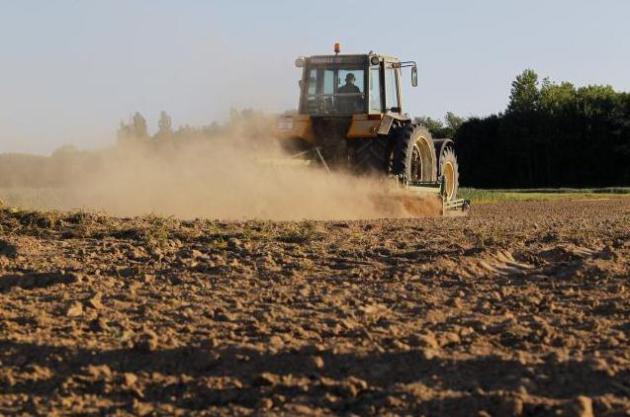
Grim Harvest: Climate Change Sweeps Iowa Farms. Many farmers, initially skeptical about climate change, are reconsidering their views, considering their experiences out in the fields in recent years. Climate volatility has gone from theory to reality. Here’s an excerpt of an Op-Ed at Live Science: “…He’s seen disease outbreaks when conditions are too wet, and lower yields when it’s too dry. Until recently, he was pretty skeptical that climate change had anything to do with it. “Before the last three or four years, I guess my vision of the world of climate change was about a few people trying to make money on the deal,” Gaesser said. He figured people were just marketing high-efficiency this and low-carbon-emission that, just to make a buck. “But as a farmer, in the last several years, we are actually seeing those changes happen here on the farm…” (File photo: Pascal Rossignol, Reuters).
White House Announces New Climate Change Initiatives. National Geographic has the story; here’s a clip: “…The National Journal runs down the individual efforts by agency, which include a more than $236 million award to fund eight states’ efforts to improve rural electric infrastructure and a new guide by the Centers for Disease Control that will help local public health departments assess their area’s vulnerabilities to health hazards associated with climate change…” (File photo: Matt Brown, AP).
