
Snowfall Potential – NWS Forecast
_____________________________________________________________________________
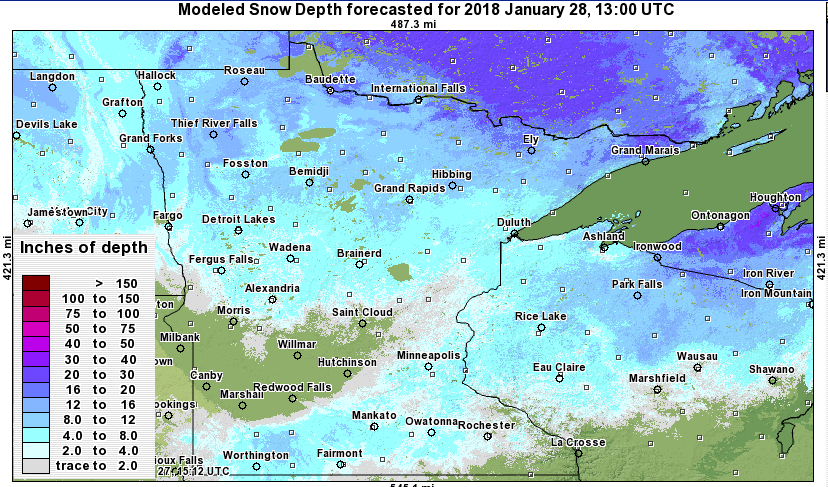
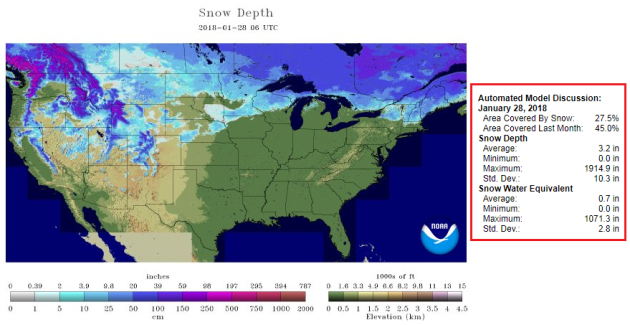
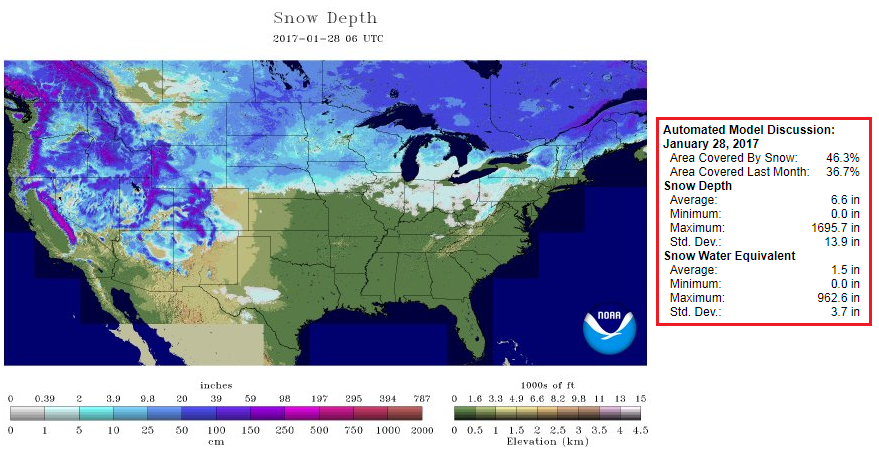
Snow Depth 2018
 ____________________________________________________________________________
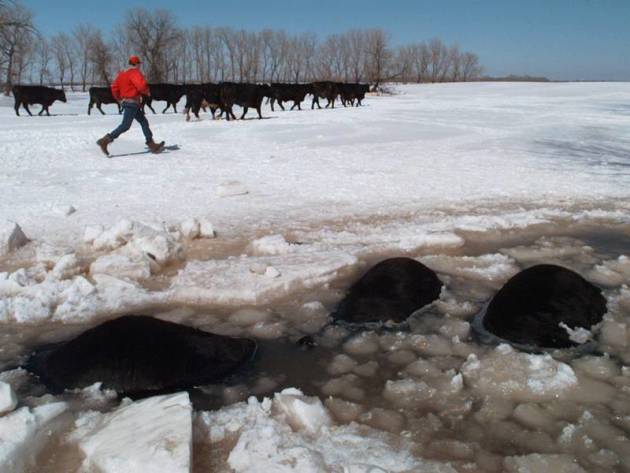
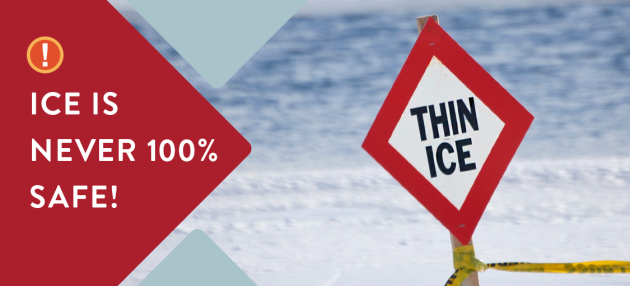
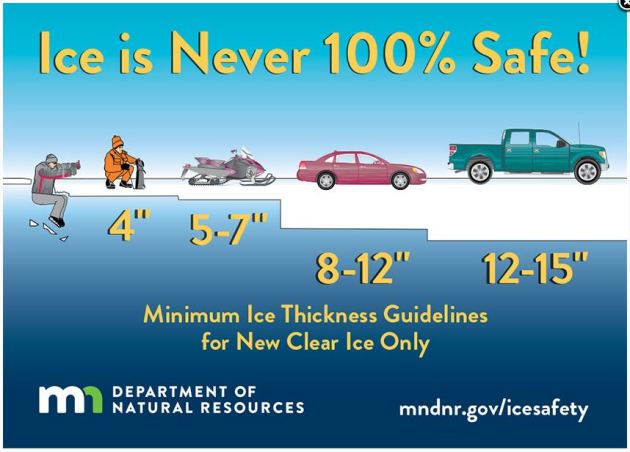
General Ice Thickness Guidelines
Under 4″ – STAY OFF
4″ – Ice fishing or other activities on foot
5″ – 7″ – Snowmobile or ATV
8″ – 12″ – Car or small pickup
12″ – 15″ – Medium truck
Many factors other than thickness can cause ice to be unsafe.
White ice or “snow ice” is only about half as strong as new clear ice. Double the above thickness guidelines when traveling on white ice.
___________________________________________________________________
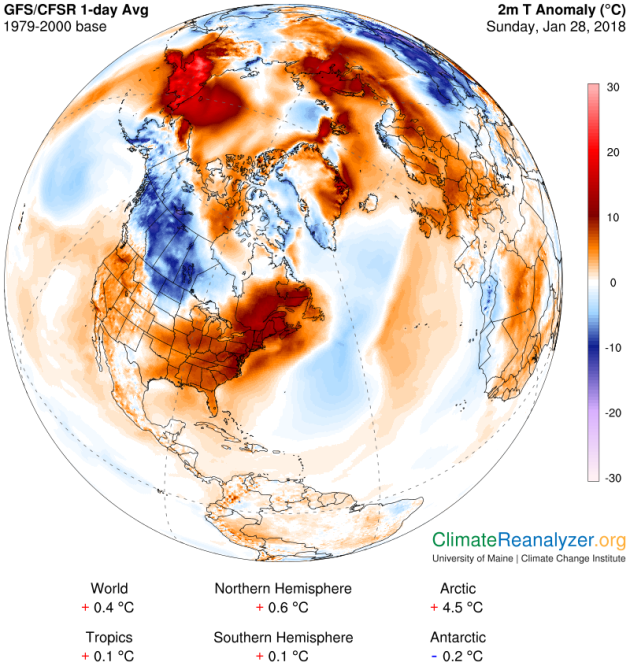
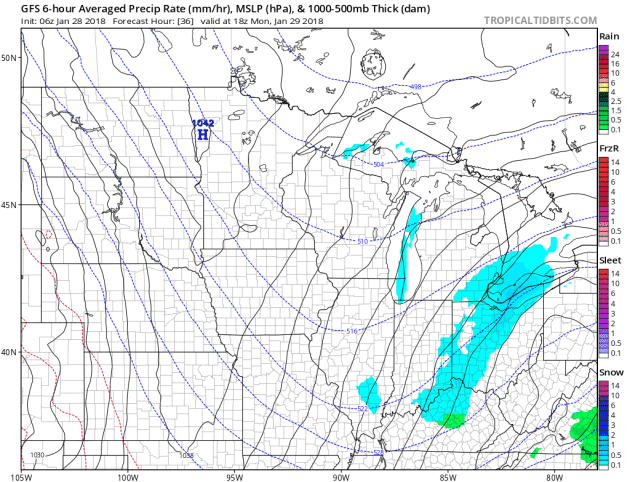
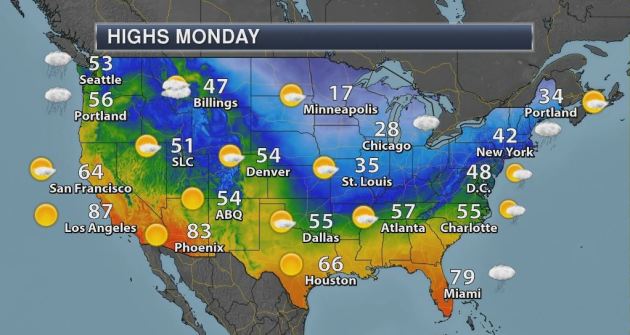
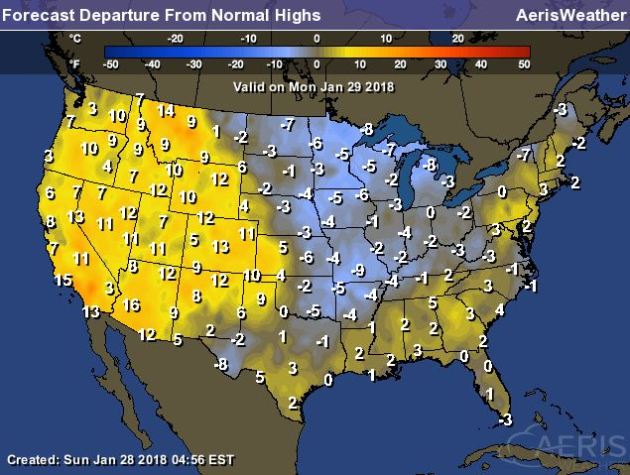
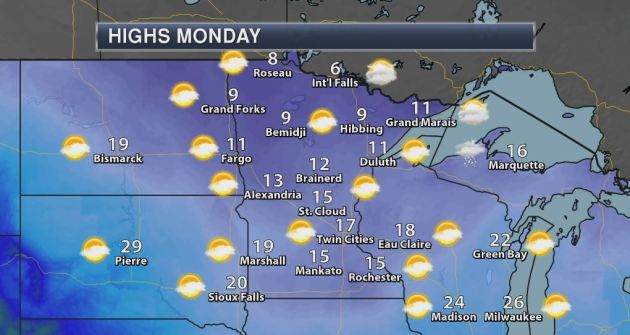
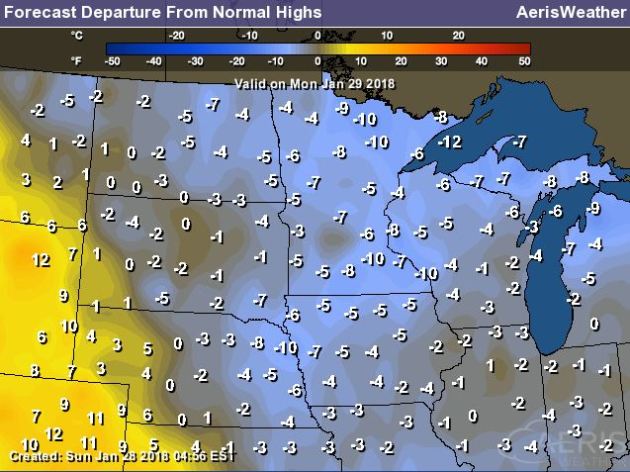
First things first. Here’s a look at weather conditions across the nation on Monday. Temps in the Central US will be running a little bit below average, but the western half of the country looks to be quite mild with temps running nearly 10F to 15F above average.
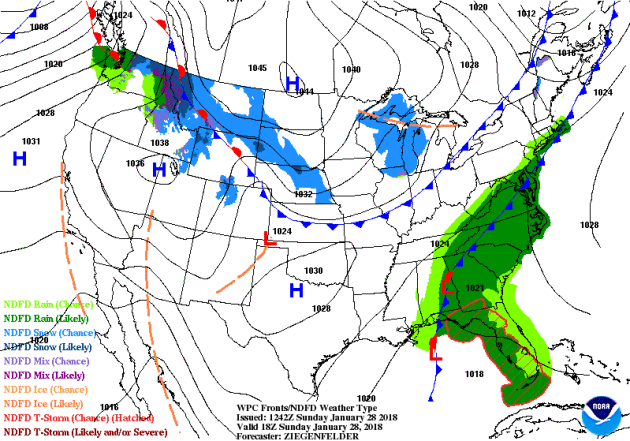
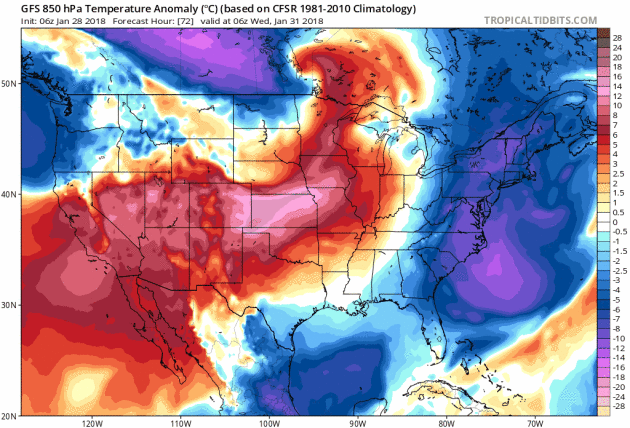
According to NOAA’s WPC, the 5-day precipitation outlook suggests areas of heavy precipitation across parts of the Eastern US and across the Pacific Northwest. A storm system dropping heavy rain from the Southeast to the Mid-Atlantic States on Sunday will by AM Monday, but will bring areas of snow to the Northeast through Tuesday. Take a look at the heavy moisture that will pound the Pacific Northwest over the week. This particular model suggests that some in far northwestern Washington and into Vancouver Island could see nearly 10″ of liquid by AM Friday! WOW!!
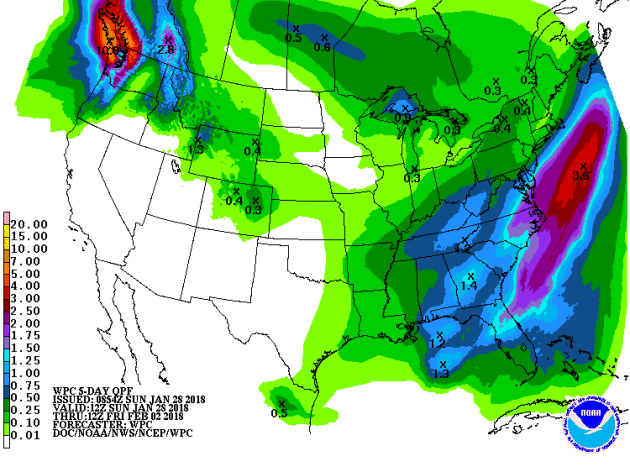
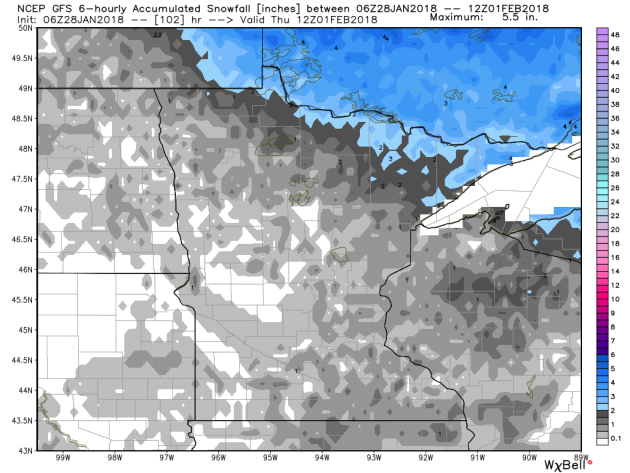
Snowfall Potential Ahead
.png)
1.) Heavy precipitation (mountain snow and valley rain) for the Pacific Northwest, Mon-Tue, Jan 29-30.
2.) Heavy precipitation for the eastern CONUS, Thu-Sat, Feb 1-3.
3.) Much below normal temperatures for the north-central CONUS, Thu-Fri, Feb 1-2.
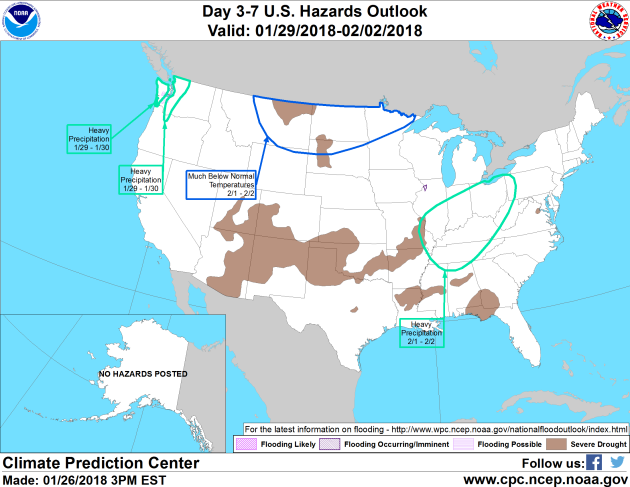
4.) Flooding possible in western Washington state.
5.) Flooding likely in northwestern Illinois.
6.) Slight risk of much below normal temperatures for the Alaska Panhandle, the northwestern CONUS, the Great Plains and Mississippi Valley, the Great Lakes region, the Ohio and Tennessee Valleys, and the Northeast, Sat-Fri, Feb 3-9.
7.) Moderate risk of much below normal temperatures across the northern half of the region included in the slight risk area, Sat-Fri, Feb 3-9.
8.) High risk of much below normal temperatures over the north-central CONUS, Sat-Fri, Feb 3-9.
Severe drought for parts of the Great Plains, Southwest, middle and lower Mississippi Valley, and Southeast.
_____________________________________________________________________
By Todd Nelson, filling in for Douglas.
Not gonna lie, I was really rooting for the home team this year. Gosh, how sweet would it have been to party in purple for “LII”? As a Vikes fan, it’ll be tough to see “Eagles” and “Patriots” painted in the endzones. Oh well, there’s always next year, right?
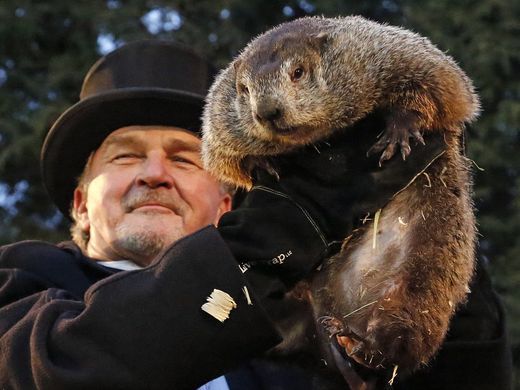
Folks traveling to MSP for the big game this week will have to gear up for another round of cold temps. We’ll all be shivering by Friday (Groundhog Day) as temps dip into the single digits with sub-zero wind chills. Our favorite furry forecaster will likely freeze his tail off in Punxsutawney. My hunch is that he’ll extend winter with La Nina still in play, we’ll see?
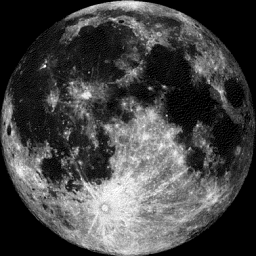
NOAA is calling Wednesday’s full moon the “Super Blood Blue Moon” as it will be the 2nd full moon of the month, also coinciding with a super moon and a total lunar eclipse! Interestingly, this is the first time this has happened since 1866! Yea, it’s rare; generally once every 2,380 full moons or once every 265 years.
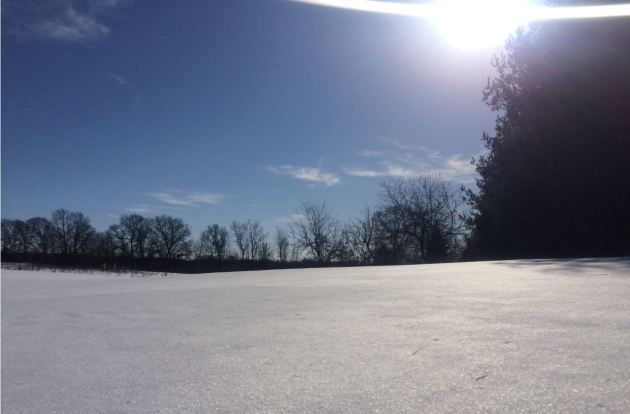
Enjoyed chilled sun today. Light snow develops late tomorrow. No accumulations.
________________________________________________________________________
Extended Forecast
MONDAY: Chilled sunshine. Winds: NNW 5. High: 16.
MONDAY NIGHT: Mostly clear and cold. Winds: Calm. Low: 5.
TUESDAY: Breezy. Light snow overnight. Winds: SSE 10-20. High: 30.
WEDNESDAY: Lingering AM flurry. Winds: WNW 10-20. Wake-up: 24. High: 32.
THURSDAY: Face-numbing wind chills return. Winds: NW 5-10. Wake-up: 2. High: 9.
FRIDAY: Cold. Increasing clouds. Few flakes? Winds: ENE 5. Wake-up: -8. High: 10.
SATURDAY: Chance of snow across southern MN. Winds: NE 5-15. Wake-up: -2 High: 12.
SUNDAY: Cold temps for the big game. Winds: NW 10-15. Wake-up: -5. High: 8.
_______________________________________________________
This Day in Weather History
January 29th
1977: Due to the extreme cold, the St. Paul Winter Carnival is held indoors for the first time.
_______________________________________________________
Average High/Low for Minneapolis
January 29th
Average High: 25F (Record: 49F set in 1931)
Average Low: 8F (Record: -29F set in 1951)
Record Rainfall: 0.52″ set in 2001
Record Snowfall: 5.3″ set in 1967
_________________________________________________________
Sunrise/Sunset Times for Minneapolis
January 29th
Sunrise: 7:36am
Sunset: 5:17pm
Hours of Daylight: ~9 hours & 41 minutes
Daylight GAINED since yesterday: ~ 2 minutes & 29 seconds
Daylight GAINED since winter solstice (December 21st): 55 minutes
__________________________________________________________
Moon Phase for January 29th at Midnight
1.3 Days Until Full “Snow” Moon
“Usually this title is reserved for a full moon in February, since world tends to be fully coated in snow by then. But this year is an oddity, in that there will be no full moon in February. (This is true for most locations on Earth, but in some places, including eastern Asia and eastern Australia, the moment of peak fullness will occur on the morning of Feb. 1.) During February, the snow and bitter cold makes hunting difficult, so some tribes called this moon the Full Hunger Moon.
This is the second time the moon turns full in a calendar month, so it is also popularly known as a Blue Moon. On average, full moons occur every 29.53 days (the length of the synodic month), or 12.37 times per year. So months containing two full moons occur, on average, every 2.72 years. This year, however, is a striking exception to this rule, as you will soon see.
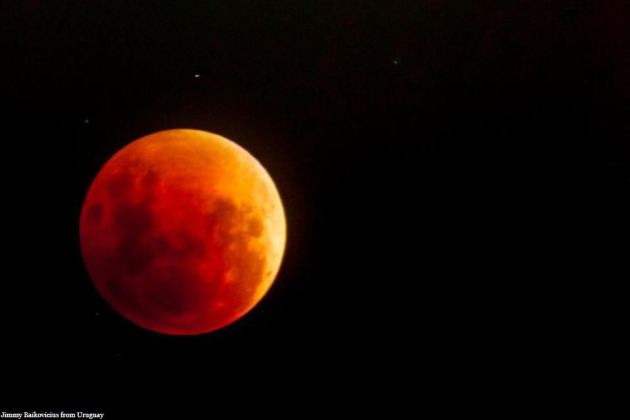
Jan. 31 will also be the night of a total lunar eclipse.The Pacific Rim — the lands around the rim of the Pacific Ocean— will have a ringside seat for this event: Totality will last 77 minutes, and at mideclipse, the moon will appear directly overhead (or nearly so) over the open waters of the western Pacific Ocean.
In the western U.S. and western Canada, the eclipse will take place during the predawn hours, but across the rest of North America, the progress of the eclipse will be interrupted by moonset.
_________________________
“How Rare Is The All-In-One Supermoon, Blue Moon, And Lunar Eclipse, Really?”
“This January 31st, something quite rare and special will happen. At 1:30 PM, Universal Time (8:30 AM Eastern / 5:30 AM Pacific), the Moon will reach its full phase for the second time in the month of January, making it a blue Moon. The full Moon also occurs very close to perigee, where the Moon makes its closest approach to Earth in its elliptical orbit, occurring close enough to create a Supermoon, where the full Moon is up to 14% brighter than average. And finally, the Moon will fully slip into the Earth’s shadow during this time, creating a total lunar eclipse. NASA is calling it the “Super Blood Blue Moon.” For observers in North America, it’s the first time all three of these phenomena will line up since 1866. But how rare is it, really, to get a Supermoon, blue Moon, and lunar eclipse all at once?”
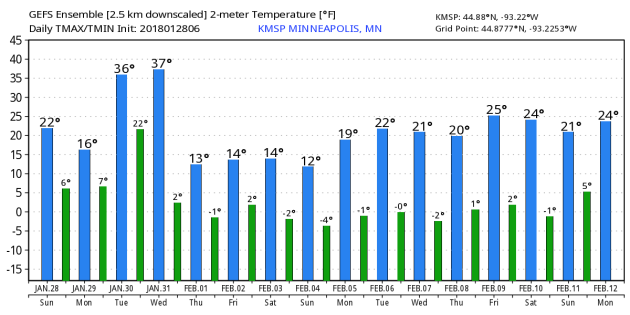
_______________________________________________________________________________Temp Outlook For Monday
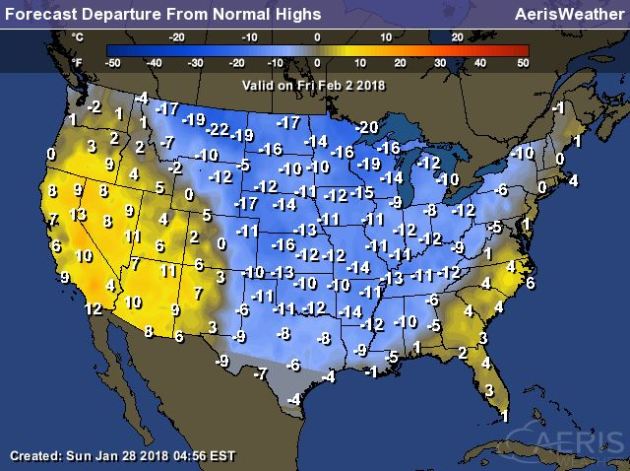
Here’s the temperature outlook as we head into the 2nd week of February, which suggests that colder than temperatures will be in place across much of the region. While temperatures will likely be colder than average, it doesn’t appear to have as big of a bite that it had at the end of December and early January.
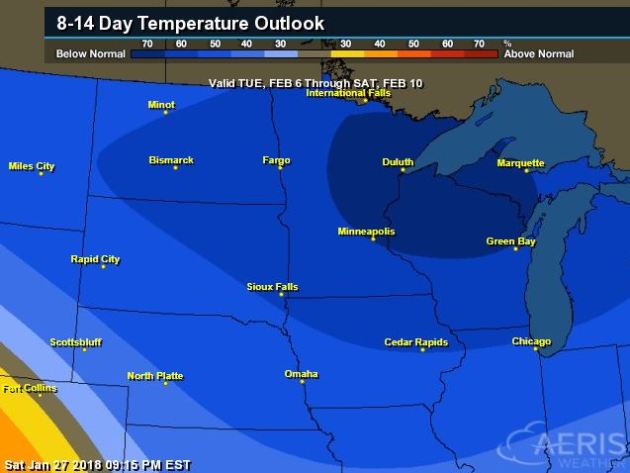
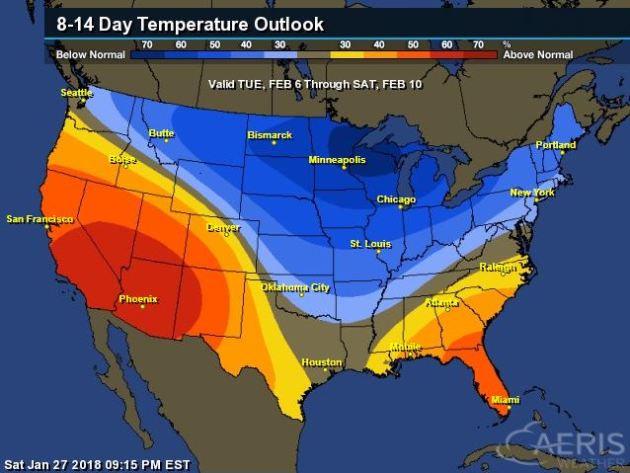
8 to 14 Day Temperature Outlook
As we head into the 2nd week of February, warmer than average temperatures will still be in place across the Southwestern and Southeastern US, while much of the central and northern part of the nation will still be running below average.

____________________________________________________________________________
___________________________________________________________________________
___________________________________________________________________________
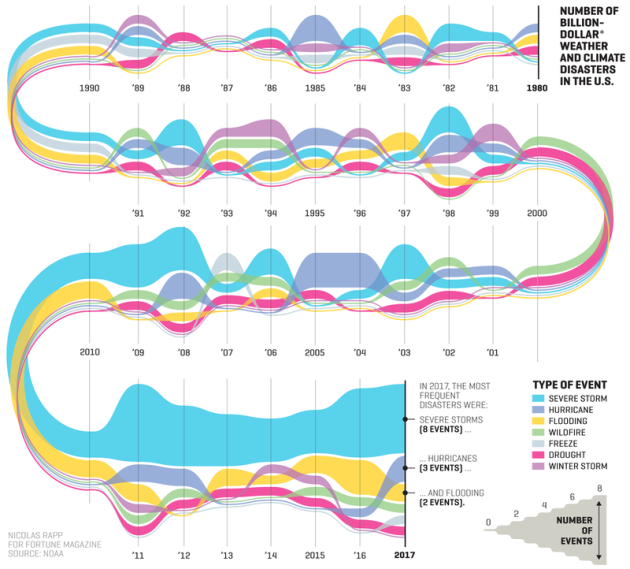
“The Number of Billion-Dollar Weather Disasters in the U.S. Is Surging”
“Extreme weather is becoming more common, and the economic impact is soaring. Last year there were 16 weather events in the U.S. that caused at least $1 billion each in damage, according to the National Oceanic and Atmospheric Administration. The cumulative cost was $306 billion—easily surpassing the previous one-year record of $215 billion set in 2005. In September a report from the nonprofit Universal Ecological Fund, “The Economic Case for Climate Action in the United States,” estimated that total climate-related economic losses and health costs in the U.S. averaged $240 billion a year over the past decade. The authors project the annual cost will rise to $360 billion over the next 10 years.”
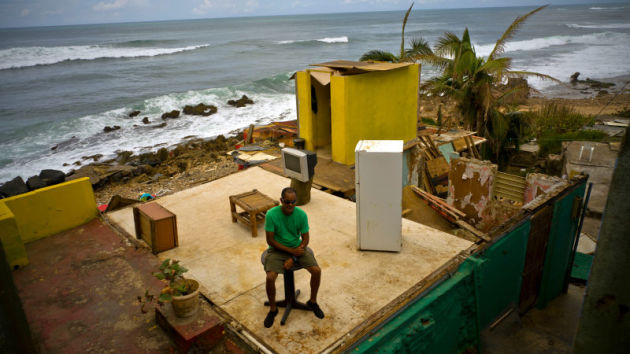
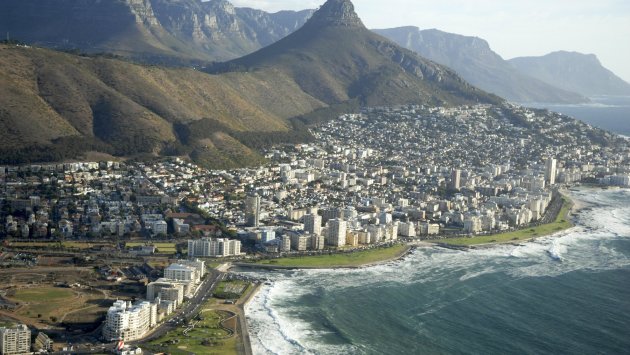
____________________________________________________________________________“CAPE TOWN’S WATER CRISIS IS SO SEVERE, EVEN LUXURY TOURISTS ARE FEELING IT”
“For people who know it, Cape Town is a city that can feel defined by its mind-boggling levels of inequality. But for travelers being catered to by the city’s sophisticated luxury travel market, Cape Town’s rampant challenges often stay shielded from view. However, the city’s increasingly severe water crisis—which has Cape Town officials warning that “Day Zero,” when the city will turn off its taps, could come as soon as late April—is a reality that even the city’s finest hotels aren’t shielding their guests from. In fact, as a whole, five star and ultra luxury properties are responding to the crisis with an urgency that is somewhat surprising—especially when you consider the types of wealthy guests they generally serve.”
______________________________________________________________________________
Thanks for checking in and don’t forget to follow me on Twitter @TNelsonWX