85 F. high temperature Wednesday in the Twin Cities.
81 F. average high on August 12.
80 F. high on August 12, 2014.
August 12, 2000: Record setting dew points in Minnesota. The Twin Cities had a dew point of 76 with a rare 80-degree dew point at Faribault. Source: Twin Cities National Weather Service.
August 12, 1821: The end of an eight-day heat wave at Ft. Snelling. Temperatures were in the 90s each day.

July Flashback
“It’s not the heat, it’s the humility!” Stupid auto-correct. Sorry. When in doubt blame El Nino – or the dew point, which rises into the drippy 70s the next couple of days. The Swamps of Minnesota!
Before we wave our little white flags of surrender it’s helpful to keep some perspective. According to NOAA the Twin Cities have only experienced 28 hours with a heat index above 90F so far in 2015. Average, to date, is closer to 112 hours. When it comes to heat we don’t have much to gripe about this year.
Today’s hot front may spark an early T-storm – but most of us won’t get rained on until Sunday, when the leading edge of cooler air sparks a ripple of showers and T-storms. Assuming the sun is out much of today, Friday and Saturday (a pretty good bet) we should hit or top 90F each day. Factor in an oppressive 70-degree dew point and it should feel like mid to upper 90s for a few hours late Friday, again Saturday – the better day of the weekend to hit the lake or golf course.
The next surge of heat sparks another round of storms and locally heavy rain next Wednesday & Thursday.
A brewing Super El Nino may favor a warm, wet bias into September; another super-sized summer?
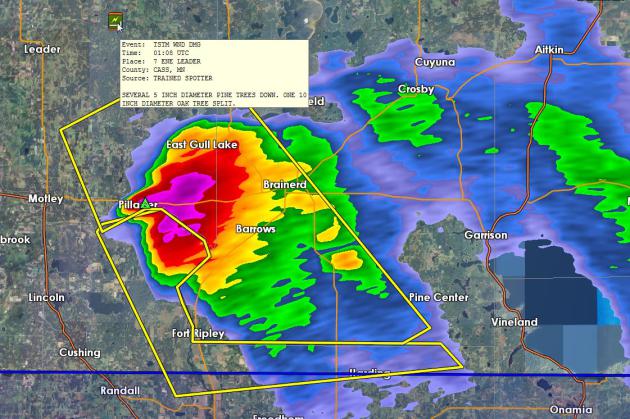
Another Round of Severe Storms for the Brainerd Lakes. A supercell thunderstorm whipped up 2-4″ diameter (golfball to baseball) size hail Wednesday evening, along with wind gusts as high as 60-70 mph, downing more trees. NOAA has a complete, updated chronology of storm damage here.
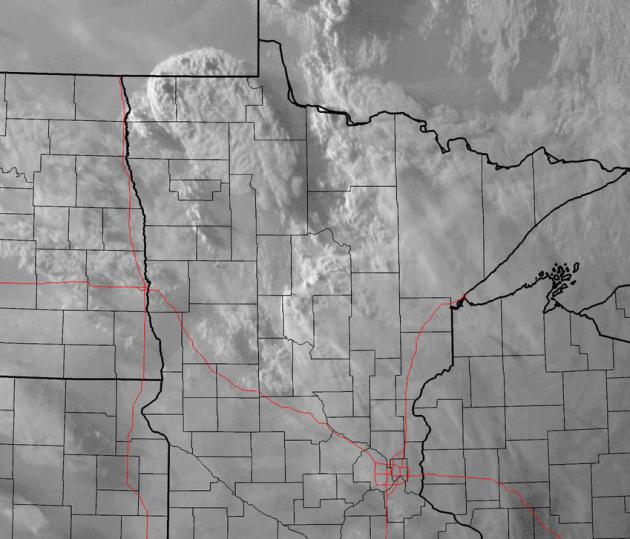
Towering Cumulonimbus. Visible satellite imagery at 7:45 PM Wednesday evening showed the severe thunderstorms that sprouted over the Red River Valley, the northwest side of these towers illuminated by the setting sun; overshooting tops as high as 50,000 to 55,000 feet above the ground marking the most violent upward motion within each cell standing out like nubs on top of the thunderstorm anvils. Prevailing jet stream winds swept those cirrus anvils southeast. Imagery: AerisWeather.
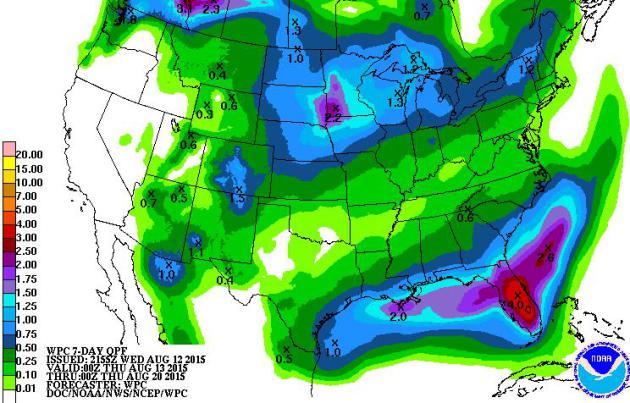
7-Day Rainfall Potential. More heavy rain is predicted for Florida (just what the Tampa area doesn’t need right now). NOAA models are also showing some 1-2″+ amounts from eastern South Dakota into much of central and western Minnesota between now and next Thursday.
GFS Guidance. The 10-Day outlook calls for a wetter, slightly cooler spell of weather next week, coming after a few days at or just above 90F (today into Saturday). Right now Saturday looks like the sunnier, hotter, drier day of the weekend – a better chance of T-storms Saturday night into a portion of Sunday as cooler air approaches. Model guidance: NOAA.
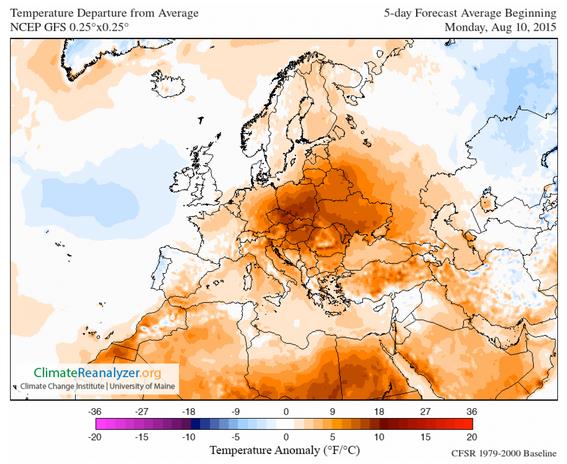
Central and Eastern Europe Simmering in Historic Heat Wave. Although the duration of extreme heat is less than 2003, the intensity is even greater. Jason Samenow has the story at The Capital Weather Gang; here’s a snippet: “…Central and eastern Europe are in the grips of a record-breaking heat wave, that may persist for at least another week to ten days. A number of locations in Germany set all-time highs last Friday and more records are likely to fall over the coming days, particularly in eastern Europe. The heat wave commenced late last week. On Friday, Weather Underground meteorologist Bob Henson reported Berlin was among more than 100 towns and cities in Germany that tied or broke all-time record highs. Berlin hit 102 degrees (38.9 Celsius) breaking its previous hottest temperature of 101.5 degrees (38.6 Celsius)…”
Map credit above: “Forecast for average temperature difference from normal Monday-Friday this week.” Image obtained using Climate Reanalyzer, Climate Change Institute, University of Maine, USA.
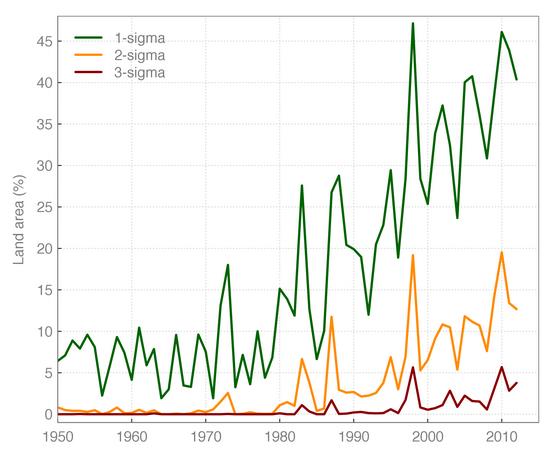
Extreme Heat Events On The Rise. More severe heat waves in a warming world? That’s what climate models have predicted for 30+ years. Is it a function of better reporting or an actual trend? Data from 2013 research authored by Dim Coumou and Alexander Robinson shows 1, 2 and 3-sigma heat events (a 3-sigma event would be 3 times the standard deviation – an exceptionally rare occurrence). Here’s an excerpt from their paper: “Climatic warming of about 0.5 ° C in the global mean since the 1970s has strongly increased the occurrence-probability of heat extremes on monthly to seasonal time scales. For the 21st century, climate models predict more substantial warming. Here we show that the multi-model mean of the CMIP5 (Coupled Model Intercomparison Project) climate models accurately reproduces the evolution over time and spatial patterns of the historically observed increase in monthly heat extremes…”
* For readers fluent in German you can click here to get more information from Stefan Rahmstorf at SciLogs.de, who adds: “This should give a bit of context to the various heat waves happening around the planet this summer. The data clearly show the high incidence of extreme heat is part of a systematic long-term trend, not some black swan. And El Niño only plays a minor part. During 1950-1980, when also lots of El Niños happened, we had nothing like the current levels of extreme heat, which are even during normal years without El Niño much more widespread even than with the massive 1982/83 El Niño.”
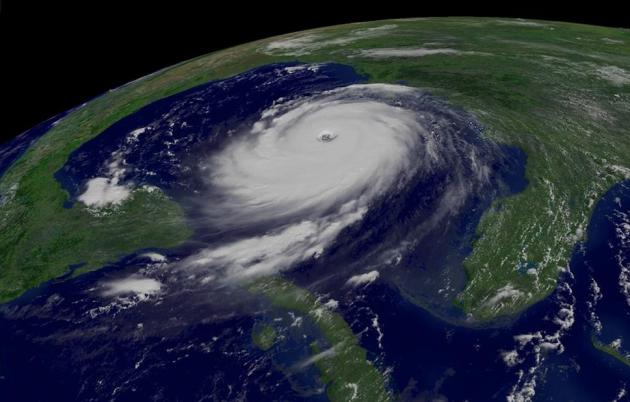
A Look Back at Hurricane Katrina: 10 Years Later New Orleans’ Tourism Industry Thrives. Mlive.com has an interesting article about the comeback of New Orleans, a city many wrote off after Katrina decimated the area in 2005; here’s an excerpt: “Ten years after Hurricane Katrina hit New Orleans, the city’s tourism has not only rebounded. It’s practically been reinvented. New Orleans had just 3.7 million visitors in 2006, the first full year after Katrina. Last year, there were 9.5 million visitors. The city has 600 more restaurants than 10 years ago. And hotel occupancy rates are higher than they were before the levees broke Aug. 29, 2005, flooding 80 percent of the city and killing hundreds…” (File image: NOAA).
Do You Have What It Takes To Predict The Future? The Reality Behind Becoming a Meteorologist. Thanks go out to The Vane for providing a little perspective and background on the difficult science meteorologists deal with every day; here’s a clip: “…A new reality show is throwing folks in front of a green screen and jamming them into wind tunnels to see if they have the guts to be America’s next great weatherperson. It’s common to brush off meteorologists as a group of lying guessers, but it takes an incredible effort to accurately predict the future every day. Meteorologists on Twitter are rumbling with an uneasy curiosity over a new reality show on a cable network famous for Conan and preempting episodes of Seinfeld to show midday baseball games…”
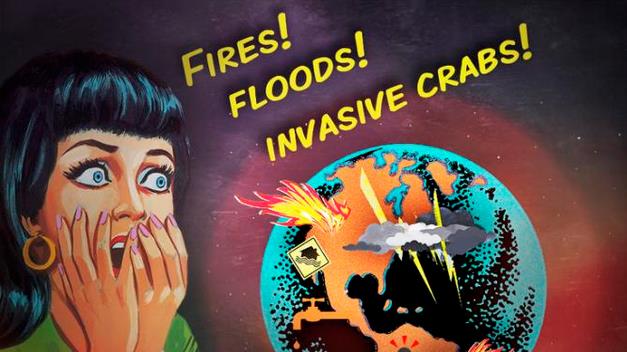
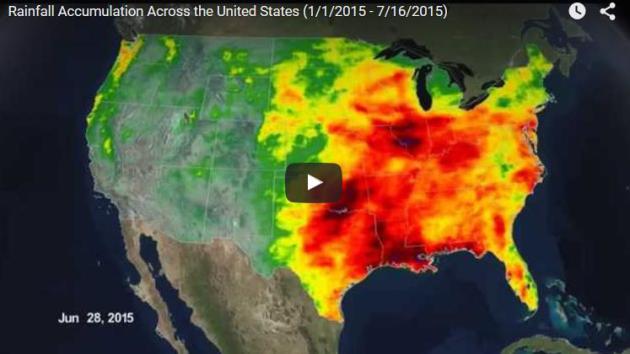
NASA’s 14 Second Video Says It All. A serious case of all or nothing when it comes to rainfall in 2015. Here’s an excerpt from EcoWatch: “…NASA produced a video last week that helps visualize what we already know to be true. The first half of this year has been a really wet one overall for the eastern and southeastern U.S. and a very dry one for the West and Southwest. This year is expected to be the hottest on record and May and June already smashed records for heat and rainfall in many parts of the country. We know that with climate change, heavy downpours are increasing, especially in areas that already receive abundant rainfall, while drought-prone states like California and the rest of the West continue to be mired in an epic drought.…”
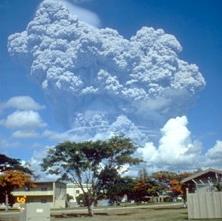
What If The Yellowstone Supervolcano Erupted. Bend over and kiss your ash goodbye. A plowable amount of volcanic ash would result, along with enough new aerosols in the upper atmosphere to cool the Earth by several degrees and create a temporary nuclear winter, capable of decimating agriculture. Other than that nothing to worry about. To paraphrase comedian George Carlin “…don’t sweat the thundershowers!” Here’s an excerpt of a fascinatingly sobering explainer at HowStuffWorks: “…The eruption could be expected to kill as many as 90,000 people immediately and spread a 10-foot (3-meter) layer of molten ash as far as 1,000 miles (1,609 kilometers) from the park. Rescuers probably would have a tough time getting in there. The ash would block off all points of entry from the ground, and the spread of ash and gases into the atmosphere would stop most air travel, just as it did when a much smaller volcano erupted in Iceland in 2010...” [source: Lemas]… (File photo: USGS).

Be Careful, Your Love of Science Looks a Lot Like Religion. Extremism in any form is dangerous, and no, science doesn’t have all the answers. Why are we here, what comes next? Crickets. Here’s an excerpt from an interesting article at Quartz: “…Now, a small group of contemporary psychologists have published a series of provocative experiments showing that faith in science can serve the same mentally-stabilizing function as religious beliefs. In 2013, a study published in The Journal of Experimental Social Psychology found that when subjects were stressed, they were more likely to agree to statements typifying scientism such as, “the scientific method is the only reliable path to knowledge…”
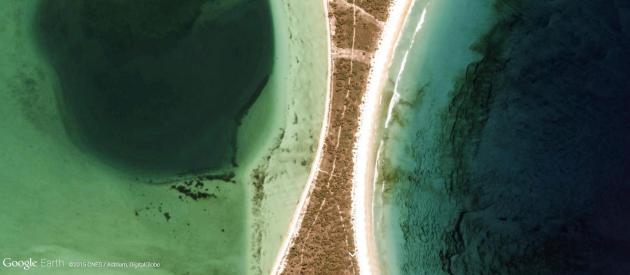
How Google Is Fighting ISIL in Syria. Here’s a snippet of a story at Quartz: “…Google—or the many products and services now under the holding company Alphabet—provides the connecting tissue between US forces and Kurdish militias fighting against ISIL in war-torn Syria. New York Times reporter Rukmini Callimachi writes from the battlefield that fighters are using Android-powered Samsung tablets and Google Earth to track their battle lines and coordinate close air support with the US military…”

It’s Hard Being “Donald Trump”. Of course we’re talking about the other Donald Trump, the oncologist. Buzzfeed has the story – here’s a link and excerpt: “…It happens nearly every day, every time he says his name over the phone or exchanges business cards or pays for a bill with his credit card. First there is the pause, then the slight smirk or raised eyebrow and finally the stale joke. Something like, “Ha ha, you’re fired!” Such is the life of Dr. Donald L. Trump, an oncologist and cancer institute executive of no relation to Donald J. Trump, the bombastic businessman and Republican presidential candidate…”
TODAY: More humid, isolated T-storm possible. Sticky sun. Winds: SW 15. High: near 90
THURSDAY NIGHT: Warm and muggy. Low: 70
FRIDAY: Steamy sunshine – plenty hot. Dew point: 73. High: 91
SATURDAY: Hot sun. Dew point: 73. Feels like 95-100F. Winds: South 10-20. Wake-up: 72. High: 93
SUNDAY: Few showers and T-storms likely. Winds: W/NW 10-15. Wake-up: 73. High: 84
MONDAY: Blue sky, less humid. Dew point: 59. Wake-up: 64. High: 75
TUESDAY: Fading sun, T-storms at night. Wake-up: 61. High: 79
WEDNESDAY: Sticky, a few heavy T-storms around. Wake-up: 64. High: 83
Climate Stories….
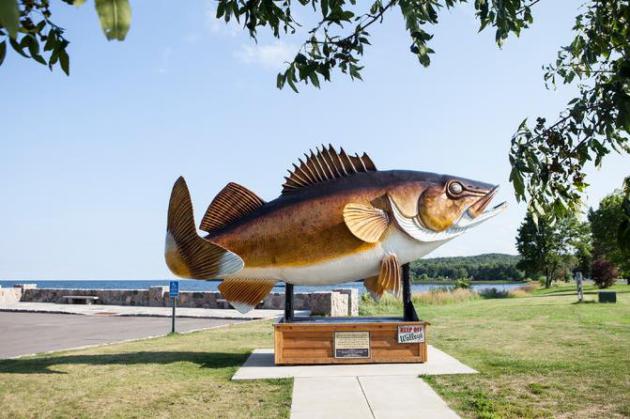
Is Climate Change A Factor in Walleye Drought on Lake Mille Lacs? Fish biologists interviewed for a New York Times article brought it up as one of several possible explanations as Mille Lacs continues to warm; here’s an excerpt: “…There is little agreement on the reasons for the apparent drop-off in the walleye population, but experts at the state’s natural resources agency say that larger prey — especially large walleye — appear to be eating younger walleye in alarming numbers. This could be because of a shortage of other fish like perch or tullibee, species that large walleye typically like to eat, but that have struggled to survive as lakes in Minnesota have gradually warmed as a result of climate change, some fish biologists say...”
Photo credit above: “A 26-foot fiberglass walleye statue greets visitors at Mille Lacs Lake in Garrison, Minn. The state has ordered an early end to the walleye fishing season amid concerns about a declining population.” Credit Jenn Ackerman for The New York Times.
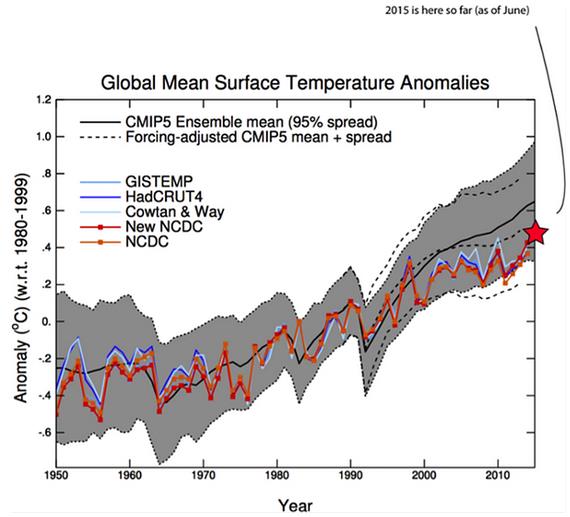
2015 Global Temperatures Are Right In Line With Climate Model Predictions. Here’s a snippet of a Guardian story from St. Thomas climate scientist John Abraham: “…The heavy dashed line is the average predicted temperature including updated influences from a decrease in solar energy, human emitted heat-reflecting particles, and volcanic effects. The dashed line is slightly above the colored markers in recent years, but the results are quite close. Furthermore, this year’s temperature to date is running hotter than 2014. To date, 2015 is almost exactly at the predicted mean value from the models. Importantly, the measured temperatures are well within the spread of the model predictions...”
Graph credit above: “Comparison of the most recent climate model simulations with actual global surface temperature measurements.” Created by Gavin Schmidt.
Study Shows No Link Between Sunspots and Climate Change. The Space Reporter has the article; here’s an excerpt: “A new study conducted by a team of researchers from the US, the UK, and Germany shows solar activity has not increased significantly since the 18th century and is therefore not responsible for rising global temperatures on Earth. Many who reject the notion that human activity is responsible for global warming have long attributed that warming to sunspots resulting from increased solar activity. Presented at the International Astronomical Union’s (IAU) 29th General Assembly in Honolulu on Tuesday, the new study discredits a method of counting sunspots first devised during the 1990s as “fundamentally flawed…” (File image: NASA).

First Click: Climate Change Deniers, Like Fanboys, Don’t Care About Your Science. For some there will never be enough evidence, according to an article at The Verge; here’s an excerpt: “…When you think about it, climate change deniers aren’t too different from flat-earthers, birthers, or people that believe the moon landings were filmed inside a Hollywood studio. Kahan’s science shows that your scientific arguments don’t matter to people with a cultural predisposition to distrust the powers at be. It also helps explain the futility of arguing with fanboys…The flame wars found in the internet comments on gadget and environmental articles are really just the flailing insecurities of individuals rationalizing their own choices..”
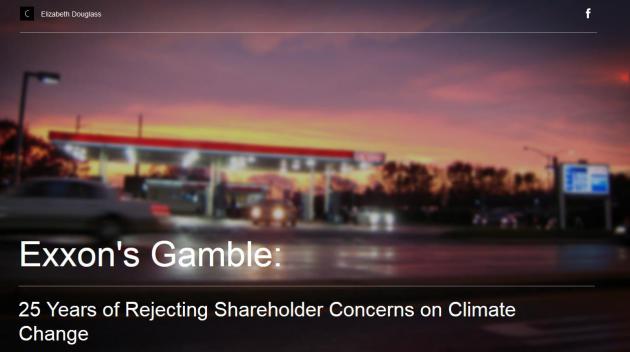
Hot Takes: The Top Climate Change Reporting of the Past Year. ProPublica has a list of some of the best enterprise stories, including “Exxon’s Gamble” from InsideClimate News; here’s an excerpt: “…Oil companies have long fought against anyone who demands change based on apocalyptic predictions of climate change, including their own investors. In fact, over the past 25 years, top executives at Exxon, Chevron and ConocoPhillips battled a combined 113 proposals from activist investors that ranged from adding board members with climate change expertise to establishing ceilings for greenhouse emissions. Not a single proposal passed…”
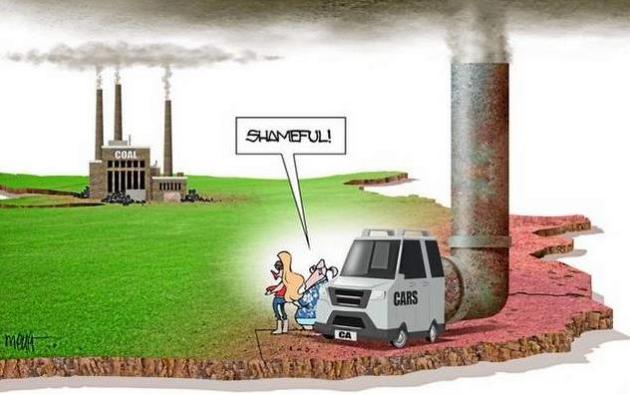
GOP Needs Better Response To EPA Climate Rules than “No”. Here’s an excerpt of an Op-Ed from syracuse.com: “…The truth is that we cannot afford to wait for “a person in a garage” to come up with a magic bullet. The technologies that can wean society off polluting fuels already exist. What we need is the economic incentive – money talks – to bring those technologies to scale. To be sure, there are technologies yet to be invented that will have a game-changing impact on our ability to undo the damage accrued from burning fossil fuels the past two centuries. But investors are more likely to fund the research and development for these new technologies if they are assured a market that values them and thus a reasonable return on their investment. What would give them such assurance? A predictable, steadily-rising fee on carbon pollution…” (Image credit: Tom Meyer).
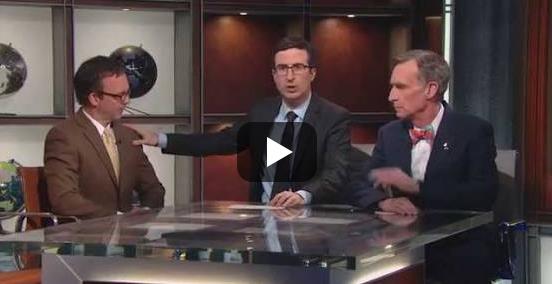
Forget “97% of Climate Scientists”. It’s More Like 99.1% Just in case you missed this story at Yahoo News; here’s an excerpt: “… But if (John) Oliver really wanted to be up-to-date on his stats, he would have put 99.99 scientists on one side of the desk. That’s according to James L. Powell, director of the National Physical Sciences Consortium, who reviewed more than 24,000 peer-reviewed scientific articles on climate change published between 2013 and 2014. Powell identified 69,406 authors named in the articles, four of which rejected climate change as being caused by human emissions. That’s one in every 17,352 scientists…”
* John Oliver’s memorable clip is here, courtesy of YouTube and HBO.
Yes Mr. President, We Remade Our Atlas To Reflect Shrinking Ice. Want a nervous breakdown? Try being a cartographer with a specialty in the Arctic. Here’s a clip from National Geographic: “…The shrinking of the Arctic ice sheet in the 10th edition of the National Geographic Atlas of the World is one of the most striking changes in the publication’s history. After the publication of the atlas in September 2014, the ice has melted even further, notes National Geographic Geographer Juan José Valdés. “The end of Arctic summer is still several weeks away, and it’s still too early to say if another record will be broken. But one need only look at the maps derived from satellite imagery to see the impact of global warming,” he says...”
Animation credit above: “A GIF of National Geographic atlases from 1999 through 2014 shows how Arctic ice has melted over time.” Source: National Geographic Maps.
