
Bad Vacation
“There are two seasonal diversions that can ease the bite of any winter. One is the January thaw. The other is seed catalogs” wrote author and journalist Hal Borland. All I know is any day above zero – in late January – in Minnesota – is a gift from on high.
40 degrees? That’s a bad vacation.
Take the good with the bad and make the most of today’s drippy thaw, as a puff of Pacific air swirls across the state. Temperatures may shoot into the 40s next Wednesday before a sharp tumble late next week; models hinting at a few nights below zero from February 1-3, followed by a rapid rebound. No prolonged school-closing cold waves are brewing.
I’m still seeing evidence of a weak El Nino resetting the storm track from the Gulf of Mexico right up the East Coast, sparking a veritable parade of major snow and ice events out east. Closer to home Minnesota snow lovers will have to be content with dribs and drabs of snow. Par for the course.
NOAA models aren’t very impressive, but the ECMWF prints out a couple inches of snow Sunday. By the end of next week there will be no doubt in your mind that it’s January.
But seed catalogs and The Boat Show are reminders that spring isn’t that far off!
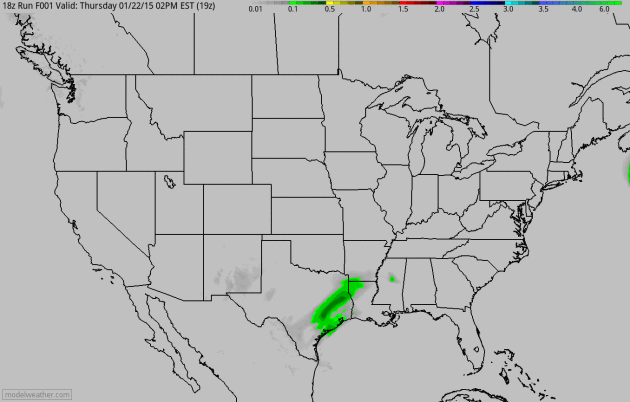
Southern Detour. I’m seeing evidence of a mild El Nino in the positioning of the prevailing storm track, pushing a series of sloppy southern storms across the Gulf Coast into the Eastern Seaboard, a significant percentage of these brewing low pressure systems morphing into full-blown nor’easters in the coming weeks. One such southern storm will soaks the south before pushing a shield of heavy rain, ice and snow into the Mid Atlantic and coastal New England. 60-hour NAM accumulated precipitation: NOAA and Aeris Weather.
Snowy Streak. The same NAM guidance shows a potential for accumulating snow from the hills of west Texas to Chattanooga, Baltimore, the Delaware Valley into the western suburbs of Boston, where some plowable amounts are possible.
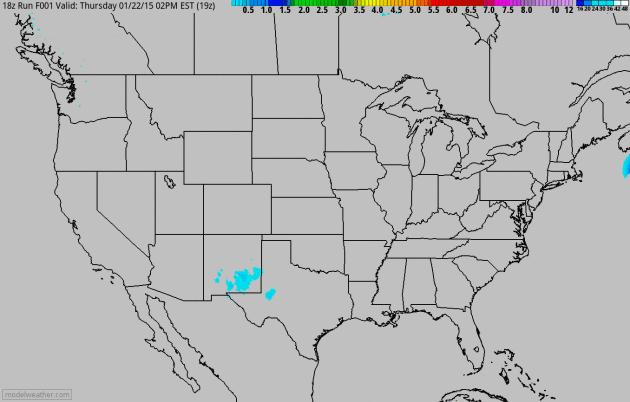
Near-Miss? NAM guidance shows the next clipper pushing plowable amounts of snow across the Minnesota Arrowhead into central Wisconsin late Saturday night into midday Sunday, although ECMWF (European) guidance suggests this snowy stripe may set up closer to St. Cloud and the Twin Cities. Clippers are notoriously fickle; it’s still premature to get specific with “how many inches?” but we could still wind up with some accumulating snow Sunday morning and midday.
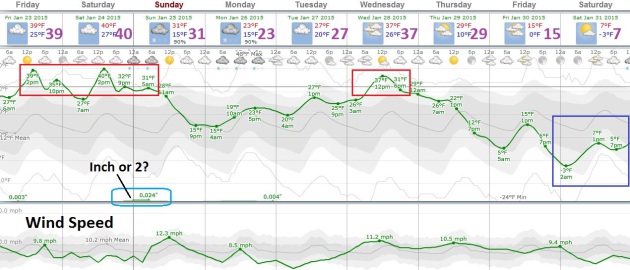
January On Hold. Averaging highs and lows, compared with normal temperatures for late January, readings should run 10-20F warmer than average into the middle of next week. Sunday’s clipper may ice up some roads late Saturday night into midday Sunday, although readings close to freezing may keep freeways more wet than snow-covered. By the end of next week temperatures drop off. Super Bowl Sunday will be Super Nippy with single digit highs, after waking up to zero.
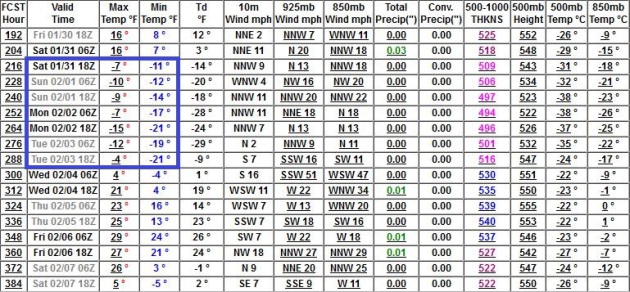
Cold Spell. As we described yesterday the pattern is progressive, back and forth, no evidence of the jet stream buckling in a pattern that causes polar air to stall nearby for week after week, similar to last winter’s infamous “polar vortex”. I get a buck every time I say that, btw. Sorry. The GFS model shows subzero lows from January 31 into February 3, daytime highs may have trouble climbing above zero the first day or two of February.
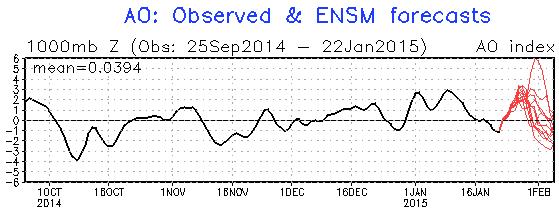
Negative Phase of AO. The Arctic Oscillation is forecast to swing to a negative phase by the end of the month, meaning a more amplified north/south kink in the prevailing jet stream winds, helping to guide much colder air into the USA. Source: NOAA.
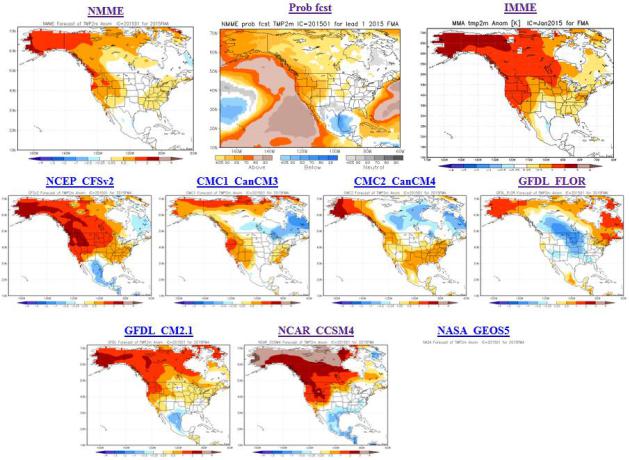
Climate Models: February into April. All but one of NOAA CPC (Climate Prediction Center) models show a mild bias February into April. Global ocean temperatures are literally off the scale, and some of this warm water coupled with a persistently zonal west to east flow should keep us from experiencing a persistently bitter late winter similar to last winter. Famous last words.
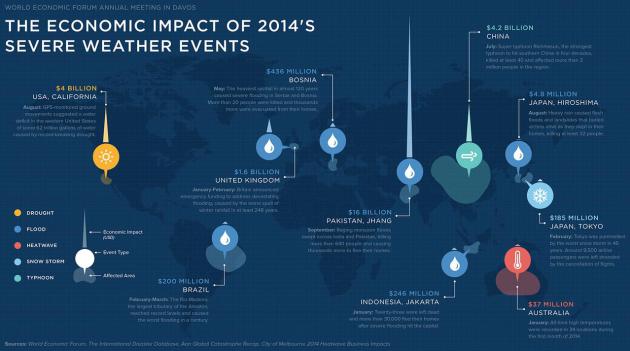
The Economic Impact of 2014’s Severe Weather Events. Here’s a link to an interesting infographic, courtesy of Quartz.

Here Are The Most Expensive Countries In The World To Live In. Unless money is falling out of your pockets you might want to avoid relocating to Norway or Switzerland, according to Huffington Post: “You might think life here in America is expensive. But it turns out that when compared to the rest of the world, the U.S. doesn’t even make the list of the 20 most expensive countries to live in. Thanks to a new infographic from Movehub, a site that provides information to those looking to move abroad, we can see clearly whose wallets have it worst off. The graphic includes a number of maps showing which nations have the highest cost of living, based on the average price of consumer goods in each country...”


TODAY: Gray but mild. Touch of drizzle. Winds: SW 10+ High: near 40
FRIDAY NIGHT: Mostly cloudy, mild for late January. Low: 28
SATURDAY: Better travel day. Any sun gives way to increasing clouds. High: 36
SATURDAY NIGHT: Light snow develops late. Low: 27
SUNDAY: Fast-moving clipper. Coating to an inch or 2″. Wake-up: 27. High: 32
MONDAY: Clouds and flurries. Wake-up: 20. High: 28
TUESDAY: Bright gray, but turning milder. Wake-up: 21. High: 35
WEDNESDAY: Early taste of March! Mild breeze. Wake-up: 28. High: 43
THURSDAY: Sunny peeks, last “mild” day. Wake-up: 30. High: 36
Climate Stories…

The Senate Officially Believes Climate Change is Real. But is it man-made or a “natural cycle”. We’re not scientists, and we don’t really trust the real scientists out there. Get back to us in 100 years ok? And God help the good people of Mississippi. The Atlantic has an update; here’s the intro: “Let it be recorded for history that late in the afternoon of January 21, 2015, the United States Senate formally acknowledged that climate change is real. As to that other critical question of whether human beings are contributing to it? Well, the Senate is not so sure. In a series of largely symbolic votes Wednesday afternoon, newly-disempowered Democrats tried to force Republicans to stake out a firm position on climate change after years of party leaders trying to dodge the question by saying they’re “not scientists...”
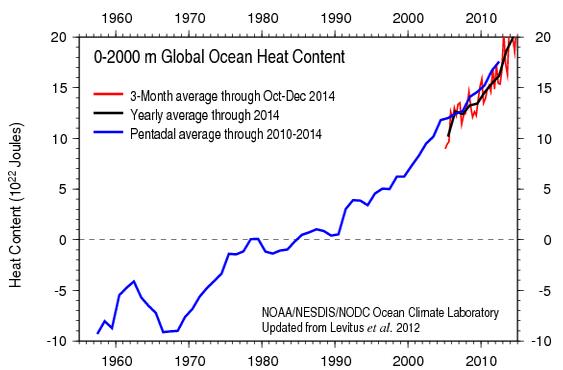
The Oceans Are Warming So Fast, They Keep Breaking Scientists’ Charts. Most of the excess heating is going into the world’s oceans, and it’s still unclear what the long term implications are of this. Dr. John Abraham at St. Thomas University has an article at The Guardian; here’s a snippet that made me do a double-take: “…So what do the new data show? Well, it turns out that the energy stored within the ocean (which is 90% or more of the total “global warming” heat), increased significantly. A plot from NOAA is shown above. You can see that the last data point (the red curve), is, literally off the chart. The folks at NOAA do a great job updating this graph every three months or so. We can now say that the 2014 Earth had more heat (thermal energy) than any year ever recorded by humans…”
Image credit: “Ocean heat content data to a depth of 2,000 meters, from NOAA.” Photograph: NOAA. You can find more data on ocean heating from NOAA here.
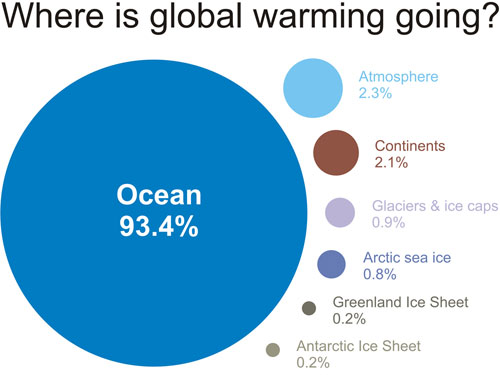
“Hottest Year” Story Obscures Bigger News: Ocean Warming Now Off The Charts. ThinkProgress has more perspective on the rapid warming of the world’s oceans; here’s a clip: “…Remember, more than 90 percent of human induced planetary warming goes into the oceans, while only 2 percent goes into the atmosphere, so small changes in ocean uptake can have huge impact on surface temperatures. That’s a key reason surface temperatures haven’t appeared to warm as fast as many had expected in the past ten years — although ocean warming has sped up, and sea level rise has accelerated more than we thought , and Arctic sea ice has melted much faster than the models expected, as have the great ice sheets in Greenland and Antarctica…”
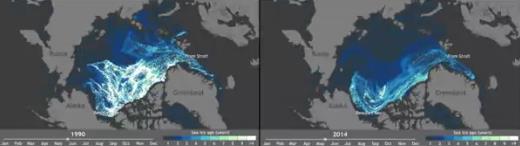
This Animation of Shrinking Sea Ice Is A Startling Illustration of Climate Change. The Washington Post has the story; here’s a snippet: “More than any other region on Earth, you can see the effects of climate change in the Arctic, where the amount of perennial ice continues to decline. This new animation released Tuesday by the National Oceanic and Atmospheric Administration (NOAA) is a startling illustration of the toll climate change is taking on our planet…”
Image credit above: “The animation above shows Arctic ice melt from 1987 to 1990, left, and 2010 to 2014, right.”

We Need Sharper Questions For A Broken Climate Debate. Aaron Huertas has a story at The Union of Concerned Scientists; here’s an excerpt: “…What may be surprising, however, is that Republican citizens have diverse views on climate science and related policy. Further, Zack Colman at the Washington Examiner just broke a story about Congressional Republicans mulling ways to reformulate their approach to climate issues. Still, journalists have their work cut out for them when they interview politicians who reject mainstream climate science. Can they do more to move our political dialogue past scientifically inaccurate talking points? I think so…”
The Lesson Of The Hottest Year On Record: Climate Change Skeptics Will Never Believe The Science. The Week takes a look at something I’m encountering: a resistance to facts, data, trends and science in general. Thinking is hard, conspiracy theories are so much easier: “…Since last year was the hottest one ever recorded, and particularly given that it wasn’t even an El Nino year (as record-breakers usually are), then one might imagine this would be time for some soul-searching among the skeptics. Not remotely. If anything, the doubters are unusually worked up in their denunciations of climate hawks, climate scientists, and sympathetic media. It provides an interesting window into the reasoning process of such people. The pause has been memory hole’d for the moment, replaced with new arguments…”
“It’s Totally Unacceptable For Society Not To Act.” Scientific American has an interview with Nobel laureate Mario Molina; here are 2 excepts that caught my eye: “…There has been a very well financed public relations campaign by some interest groups to question climate change science. And they have succeeded quite well—in response to these efforts the media very often still communicates the idea that there are two sides to this question…You wear seatbelts in your car not because you’re certain that you’re going to have a crash but because there’s a possibility. You build houses likely to withstand an earthquake not because you’re certain that there will be an earthquake but because there might be one. These examples involve probabilities that are much smaller than the probabilities that climate change will have very serious impacts. So it’s totally unacceptable for society not to act…”
Oregon Teens Sue State: Can Local Government Be Held Accountable For Climate Change? Here’s a clip from a story at The Christian Science Monitor: “…This could be a landmark decision on the question: Does government, as trustee over our essential natural resources, have to protect [the atmosphere] from carbon pollution and the impacts of climate disruption?” said Julia Olson, executive director of the nonprofit Our Children’s Trust, and originator of the youth-led lawsuit...”
