37 F. high in the Twin Cities on Thursday.
25 F. average high on January 28.
31 F. high on January 28, 2015.
3″ snow on the ground at KMSP.
January 29, 1977: Due to the extreme cold, the St. Paul Winter Carnival is held indoors for the first time.

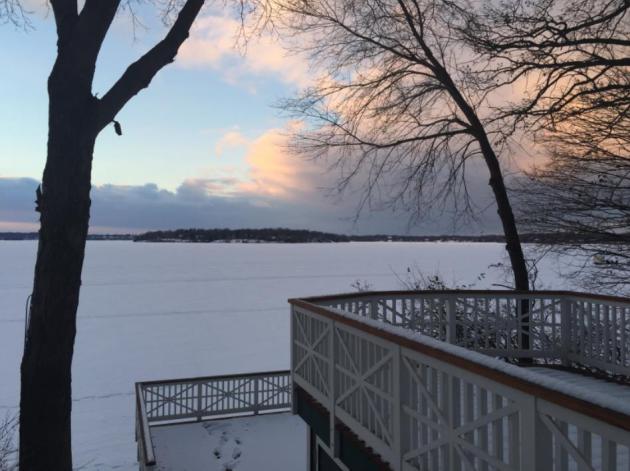
Who Are You Calling Paranoid? A Drippy Thaw into Sunday
Great, one more thing to obsess about. Zika virus? Probably not a problem, here in the Mosquito Capital of the Free World.
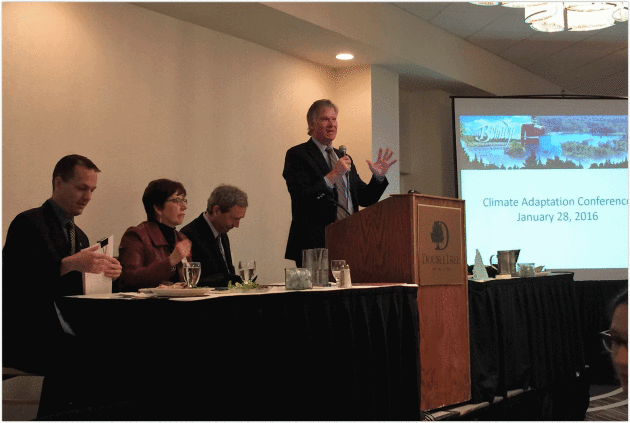
It’s easy to lapse into gloom and doom, but I was encouraged after Thursday’s 3rd Annual Minnesota Climate Adaptation Conference in Minneapolis. Minnesota cities, Fortune 500 companies, state agencies and non-profits are already spinning up solutions that will leave us more resilient, no matter what Mother Nature hurls at us – technologies, services and products we’ll export to the rest of the world.
John Lenters at LimnoTech presented a paper showing Lake Superior warming 6 times faster than the global average. Ice thickness this winter is half the average amount, comparable to 2012 and 1998, the last time we came out of a major El Nino.
A sloppy mix may fall tonight, even a few hours of rain or drizzle by Sunday. Odd for late January.
Models still point to a plowable snow Tuesday PM into early Wednesday. It won’t be Snowzilla or Snowmageddon, but it may be just enough powder to cheer up snow lovers.
Within 8-10 days it should feel like winter again.
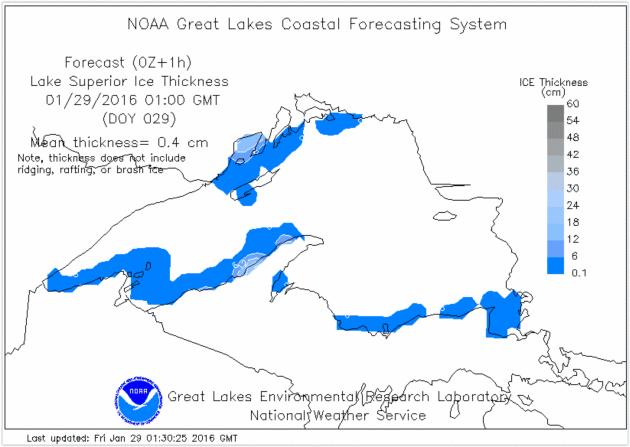
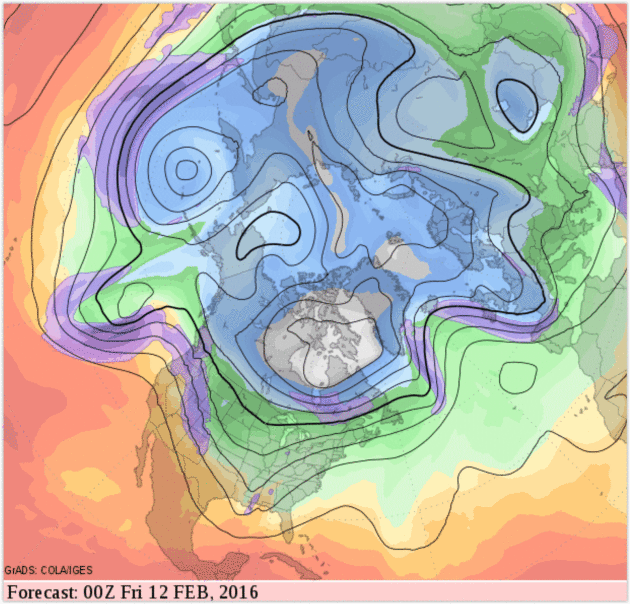
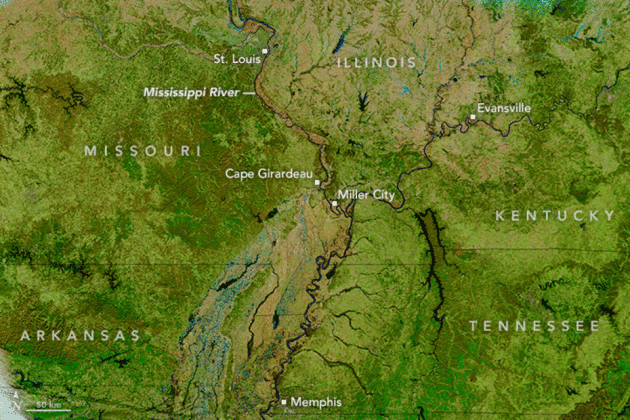
* Map above courtesy of NOAA’s Great Lakes Environmental Research Laboratory.
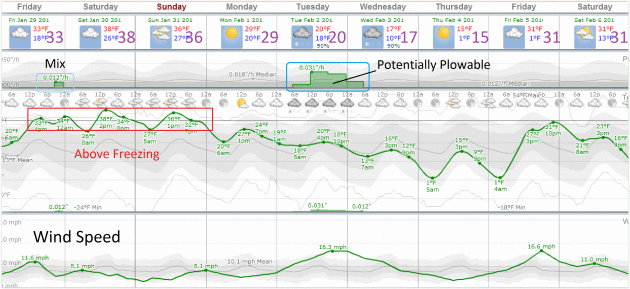
Thaw into Sunday – Tuesday Snow Event? Models are in good agreement that daytime highs should exceed 32F the next 3 days, an outside shot at 40F Saturday. The lower atmosphere may be just warm enough for a wintry mix later today – European guidance still showing a threat (opportunity) for enough snow to shovel and plow late Tuesday into early Wednesday. Source: WeatherSpark.
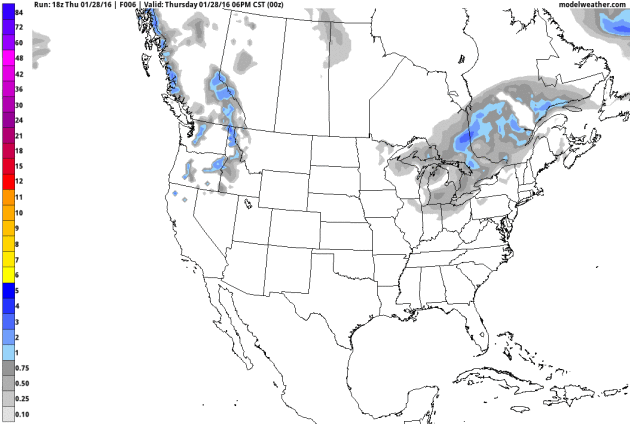
High Bust Potential. Confidence levels are still low – latest GFS model guidance showing the axis of heaviest snow setting up just south and east of MSP. A few models are hinting at 4-6″, more over Wisconsin, but it’s still too early to be tossing actual inch-amounts around. If you’re traveling Tuesday PM into Wednesday AM you’ll want to keep an eye on the latest forecasts, which will (absolutely) change 4 times a day as new model guidance arrives. Animation: NOAA and AerisWeather.
Second Week of February: Cold Enough. Although not as cold as a couple weeks ago, we may see some single digit highs into the second week of February, a few blips into the teens and 20s, but moderately cold weather may hang on through much of the first week of February. No, spring is not right around the corner.
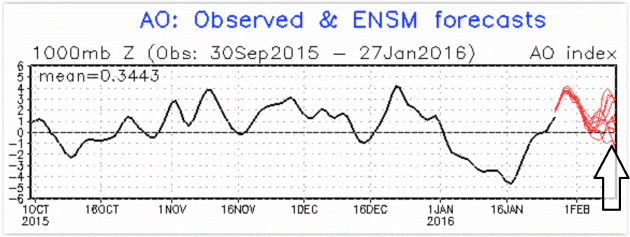
AO Goes (Slightly) Negative. Compared to the cold shot in mid-January this may only be a glancing blow of arctic air; the Arctic Oscillation (AO) forecast to trend higher after February 6 or so. Source: NOAA.
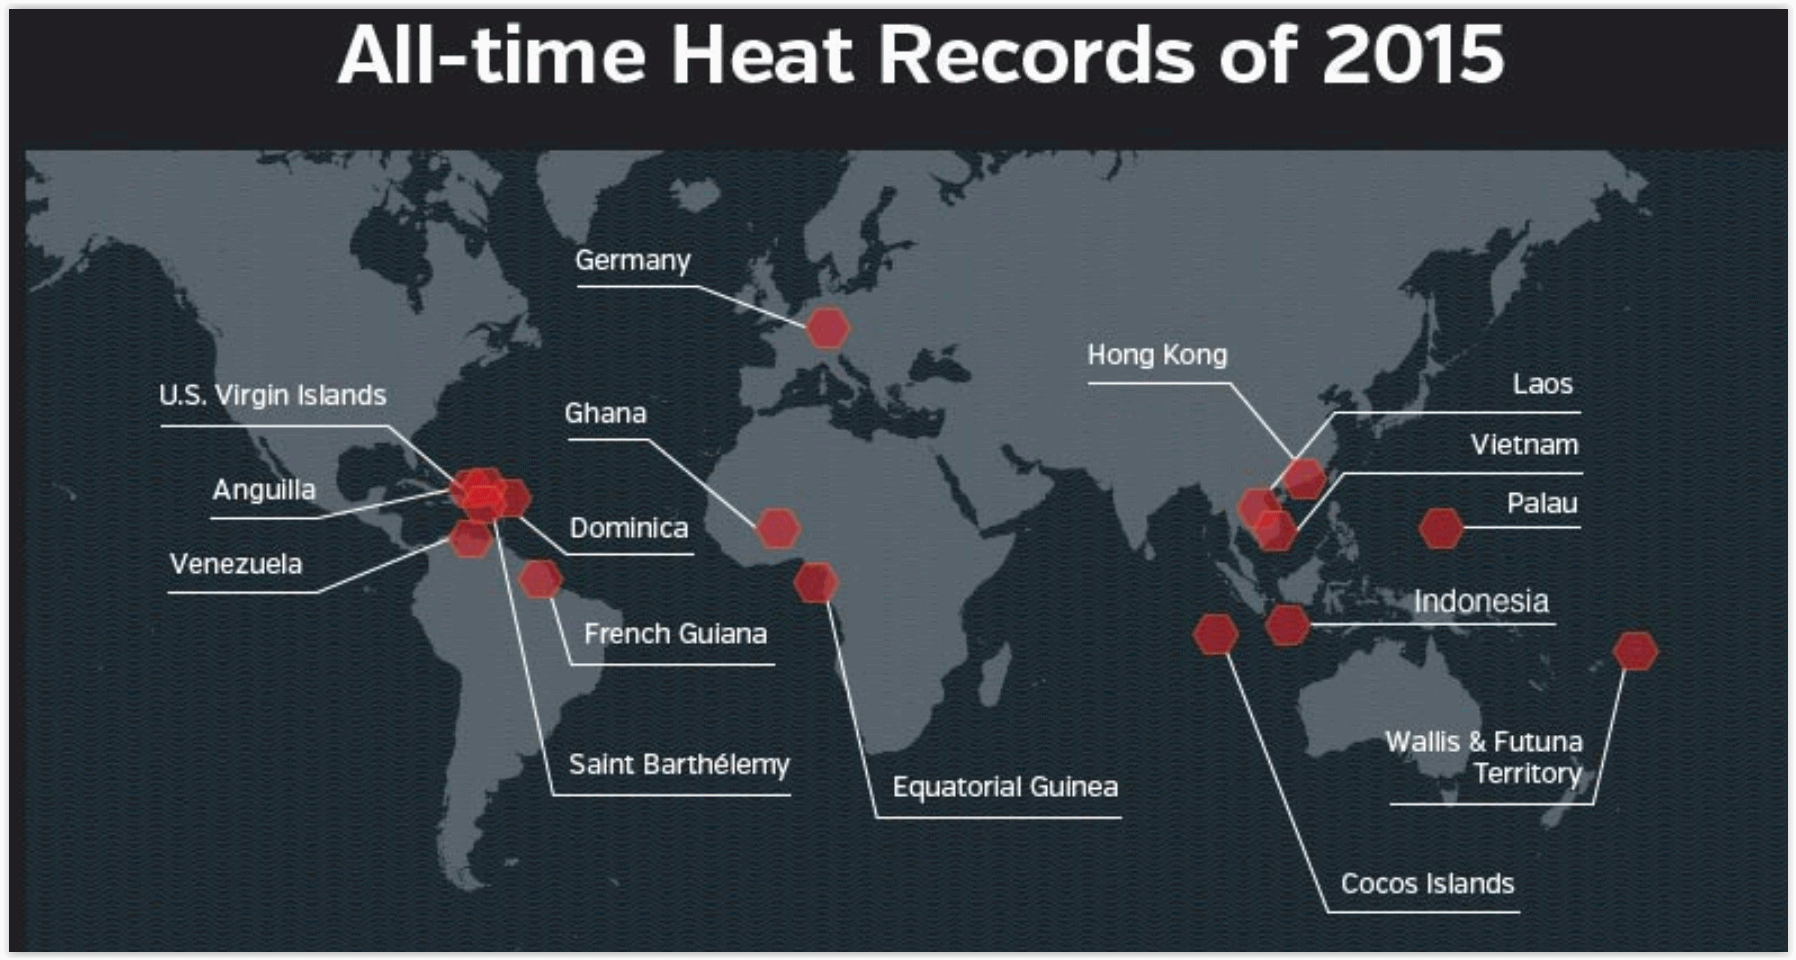
16 National/Territorial All-Time Extreme Heat Records Set in 2015. Meteorologist Jeff Masters at Weather Underground has a very interesting post; here’s the intro: “In addition to being the warmest year on record when averaged over the entire globe, 2015 was also notable for all-time extreme heat records. Sixteen nations or territories tied or set all-time records for their hottest temperature in recorded history in 2015, and two (Israel and Cyprus) set all-time cold temperature records. For comparison, only two nations or territories set all-time heat records in 2014, and nine did in 2013. The most all-time national heat records held by any year is nineteen in 2010. Most nations do not maintain official databases of extreme temperature records, so the national temperature records reported here are in many cases not official.…”
Map and data credit: Maximiliano Herrera.
Study Finds Slim Odds of Record Heat, But Not as Slim as Reported. Here’s an excerpt of a post from St. Thomas University climate scientist John Abraham at The Guardian: “…Although the new odds of producing recent runs of record temperatures by chance are greater than the odds previously reported in the news (between 1 in 27 million and 1 in 650 million), they’re still incredibly slim at between 1 in 5,000 and 1 in 170,000. Including the data for 2015, which came in after the study was completed, makes the odds even slimmer. In calculating the odds, the previous reports did not take into account that the data did not end simply because December 31 occurred, but that trends overlap into previous and subsequent years. This needs to be taken into account to determine the real probabilities of chance causing the warming events…” (Source: WMO).
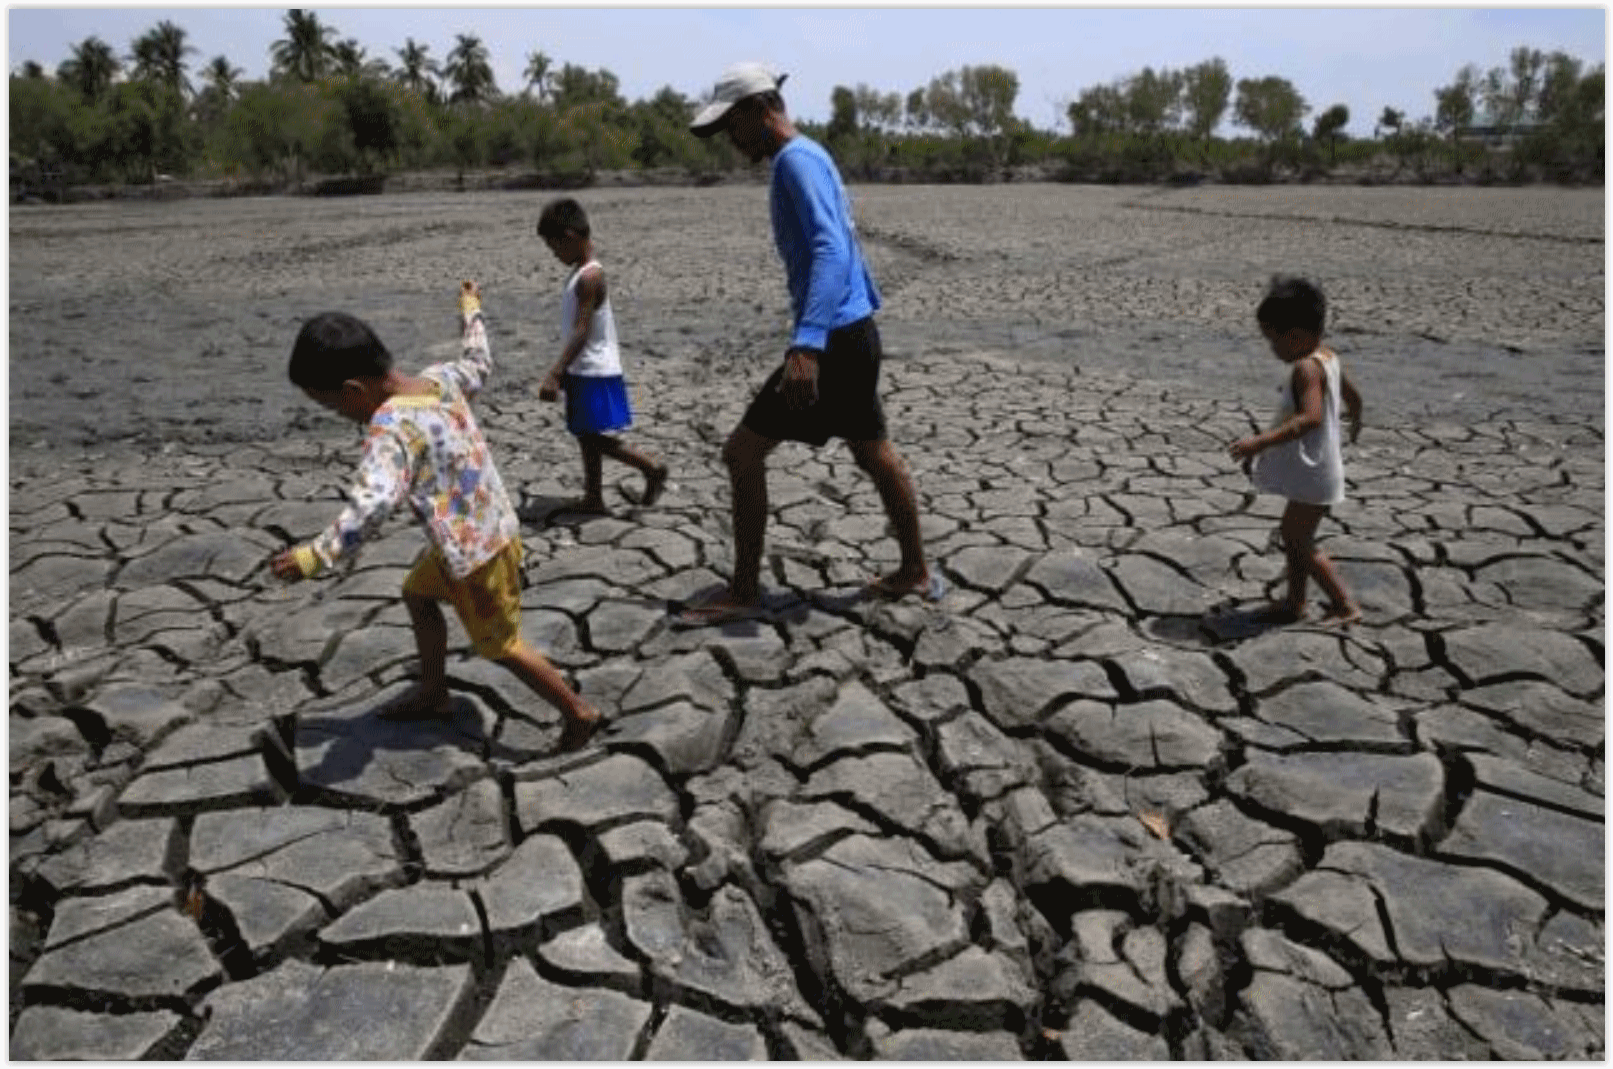
El Nino Parches Asia Pacific, Destroying Crops and Drying Up Water Supplies. Reuters has the story; here’s the intro: “Severe El Niño-linked drought has destroyed crops, killed farm animals and dried up water sources across East Asia and the Pacific, aid workers said, and UNICEF appealed for $62 million to assist children impacted by various crises in the region. Humanitarian agencies are monitoring and responding to droughts and food insecurity in an area from Indonesia and the Philippines, southeast to Papua New Guinea and the Pacific Islands. “El Niño is peaking at the moment, and we expect the impacts to come up after the peak,” said Krishna Krishnamurthy, a regional climate risk analyst for the World Food Programme...”
Photo credit above: “A father with his children walk over the cracked soil of a 1.5 hectare dried up fishery at the Novaleta town in Cavite province, south of Manila May 26, 2015.” Reuters/Romeo Ranoco.
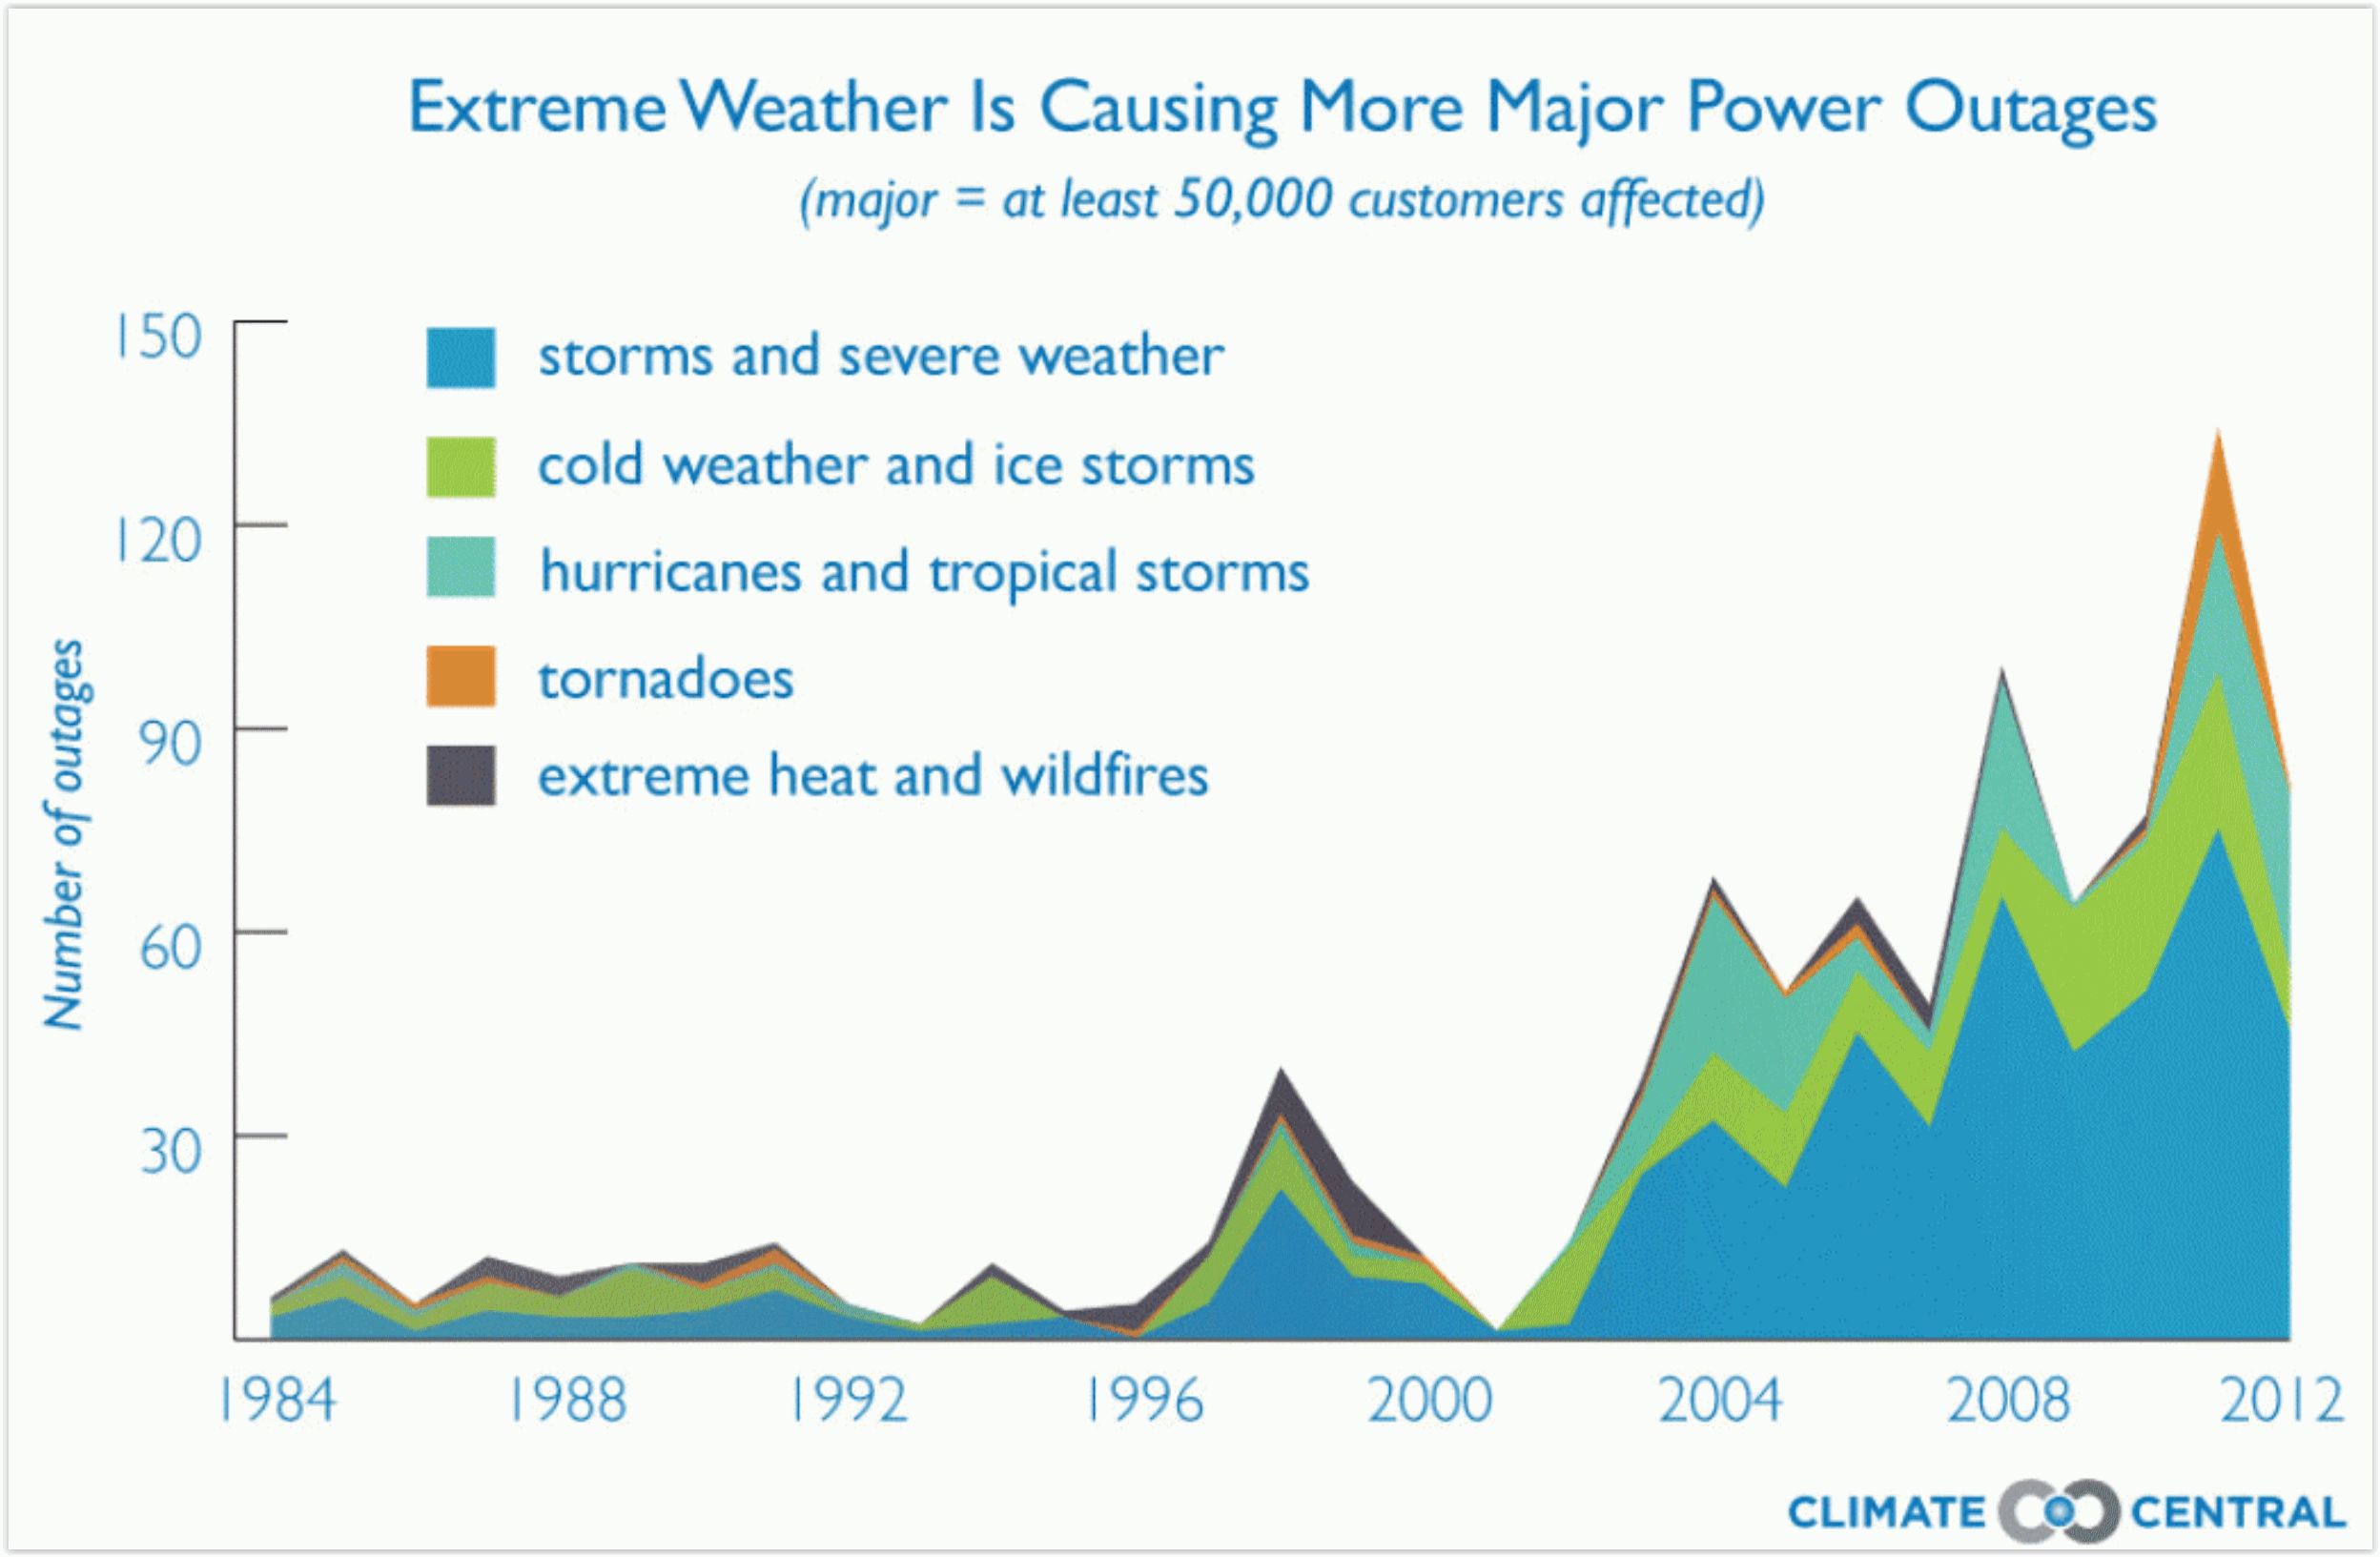
More Extreme Weather Power Outages. In light of the weekend blizzard knocking out power to so many people (especially the Carolinas with severe glaze icing) I dug up a recent Climate Central, showing an increase in weather-related blackouts since 1984. Aging infrastructure, more weather extremes, or a combination of both factors?

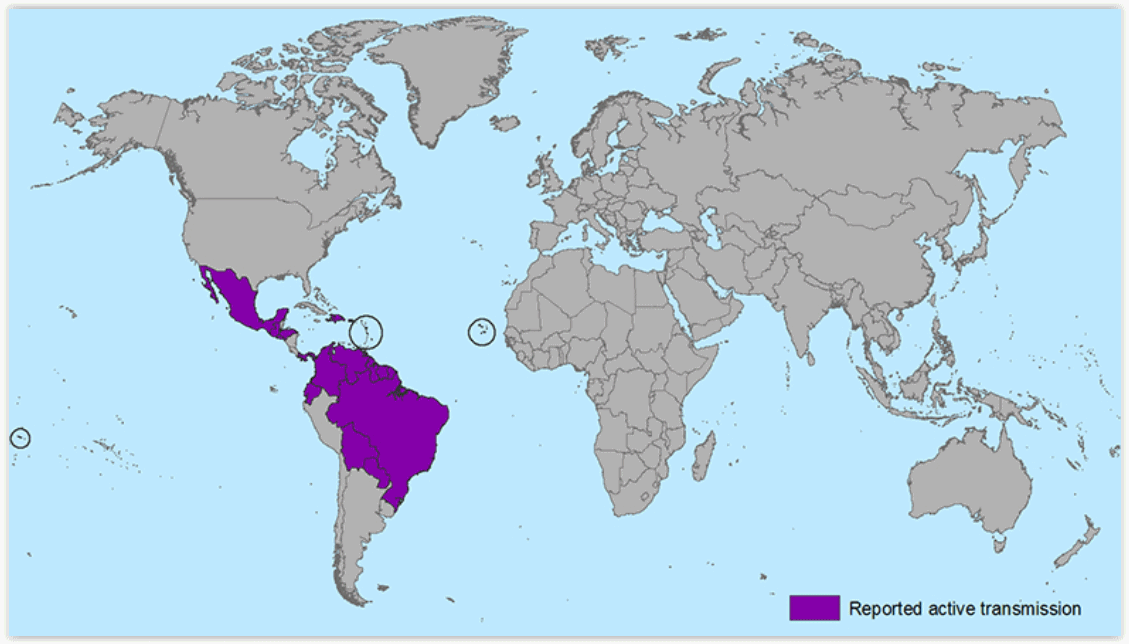
Zika Virus Spreading Explosively, Says WHO. In an effort to cheer you up here’s an excerpt from The Guardian: “The World Health Organisation has convened an emergency committee to discuss the “explosive” spread of the Zika virus, which has been linked to thousands of birth defects in Latin America. “Last year the disease was detected in the Americas, where it is spreading explosively,” Margaret Chan, the WHO director general, said at a special briefing in Geneva. It was “deeply concerning” that the virus had now been detected in 23 countries in the Americas, she added…” (Map source: CDC).
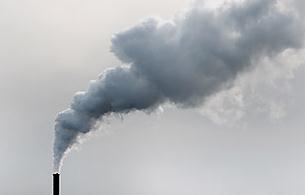
It’s Not Just Flint. Poor Communities Across the Country Live With “Extreme” Polluters. Conventional pollution or air, land and water, smog and the symptoms of carbon emissions will hit the poor the hardest – it’s already happening, according to a story at The Washington Post: “…In a new paper just out in the open-access journal Environmental Research Letters, sociologist Mary Collins of the State University of New York College of Environmental Science and Forestry and two colleagues from the National Socio-Environmental Synthesis Center and the University of Maryland examined what they term “hyper-polluters”: Industrial facilities that, based on EPA data, generate disproportionately large amounts of air pollution. Then, they cross-referenced the location of these facilities with socio-demographic data from the 2000 census...”
Photo credit above: “In this Jan. 21, 2016 photo, the Flint River is shown near downtown Flint, Mich. Flint’s water became contaminated with lead when the city switched from the Detroit municipal system and began drawing from the Flint River in April 2014 to save the financially struggling city money.” (AP Photo/Paul Sancya).

How Big a Deal Was Congress Extending the Renewable Energy Tax Credits? A Very, Very Big Deal. Dave Robers has the story at Vox; here’s the intro: “Back in December, Congress did something it rarely does any more these days — struck a series of compromises and passed a bill, specifically a giant $1.8 trillion spending bill. Among many other things, that bill extended the two key federal tax credits that support renewable energy: the production tax credit (PTC), which mostly goes to wind, and the investment tax credit (ITC), which goes to solar. It went by quickly in an otherwise news-packed month, so it’s worth pausing a moment to note that for US renewable energy it was a very, very big deal. Just how big a deal is revealed by a new analysis from the wonks at the Rhodium Group…”

Trees Offer Cheap and Effective Flood Protection. I never know when I’ll stumble upon an interesting article, but this story at The Scotsman offered up a unique perspective on flood mitigation; here’s an excerpt: “There are several ways tree planting reduces water flows:
• Trees pull more water from the ground than grass or other short vegetation and release it into the atmosphere via needles or leaves.
• Tree roots are much larger and deeper than grass roots, opening up the soil structure and allowing water to percolate into soil more quickly and deeply.
• Rain falling into woodland is intercepted by hundreds of branches, leaves and needles, taking much longer to reach the ground…”

Going Green Can Add Value To Your Home. This article at The Washington Post is focused on homes in the DC area, but the themes and suggestions are universal; here’s an excerpt that caught my eye:
Recycled and sustainable building materials wherever possible. This means maximum reuse of flooring, doors, transoms, hardware and recycled materials from elsewhere. Also non-toxic refinishes and use of recycled/sustainable materials, such as bamboo, compressed paper, butcher block for countertops, shelving and desks.
● Photovoltaic panels. Installing a solar array gives you the most demonstrable added value because it can be measured in electricity savings and possibly other incentives such as Solar Renewable Energy Credits. Solar panels installed for owners may qualify for 30 percent federal tax credit plus local or state energy incentives. Solar is often the most expensive component, but it may pay for itself relatively quickly as well.
● Sustainable landscaping. Maximum use of hardy, drought-resistant Chesapeake-area native bushes and grasses, plus storm water management systems to prevent roof runoff from flowing into municipal sewage system.... (File photo: Shutterstock).
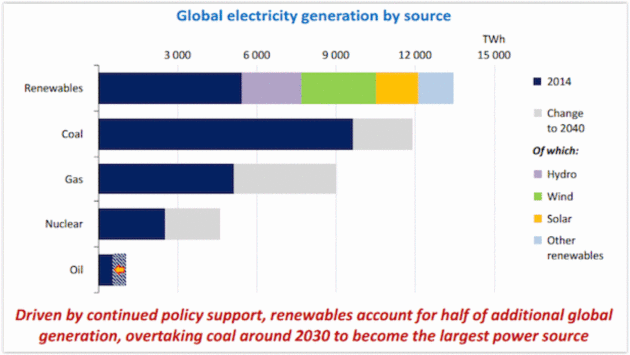
By 2013 Renewables Will Be The World’s Primary Power Source. ThinkProgress takes a look at renewables coupled with energy storage to solve the intermittency problem; here’s a clip: “...In November, the International Energy Agency quietly dropped this bombshell projection: “Driven by continued policy support, renewables account for half of additional global generation, overtaking coal around 2030 to become the largest power source.” In this post, I’ll dive deeper into this rapidly-approaching role reversal for coal and renewables. In Part Two, I’ll explain why the so-called “intermittency” problem for some renewables is basically solved and thus not a barrier to this reversal…” (Graphic credit: IEA).

Royal Caribbean Steams Ahead With New Targets for Greener Cruising. BusinessGreen has the story – here’s the intro: “Luxury cruise company Royal Caribbean has this week pledged to slash its greenhouse gas emissions by 35 percent by 2020 compared to 2005 levels, as part of a five-year partnership with WWF to boost ocean conservation. The new set of targets, which were unveiled on Monday, also see Royal Caribbean pledge to tackle overfishing by placing new requirements on its supply chains to serve sustainable fish, and donate $5mm to WWF for raising awareness about ocean conservation…”
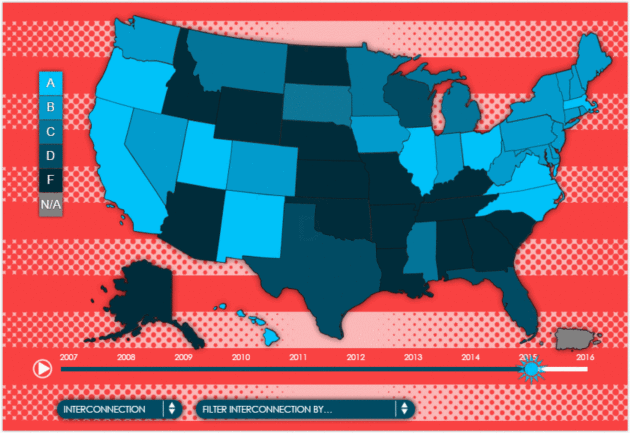
The Best and Worst States for Rooftop Solar Panels. CityLab takes a look at which states are best equipped to provide competitive solar solutions to consumers; here’s an excerpt: “…If you‘re mulling a rooftop solar installation (or any other kind of renewable energy project), it’s worth playing around with the report’s map. It grades on just two major criteria, but it gives a quick sense of how much of a headache to expect from the regulatory process in a given state, and how much you’ll benefit from the energy you produce. Here’s a quick take: if you live in Alabama, Georgia, Idaho, Oklahoma, or Tennessee, you probably want to wait for some legislative reform, because these states score F’s on both counts. If you’re a resident of California, Massachusetts, Ohio, Oregon, or Utah, though, full speed ahead: they’ve earned double aces...”
Map credit above: “The interconnection map shows more room for improvement than net metering. Many states don’t have any interconnection policy, which leads to a failing grade.” (IREC / Vote Solar).

A Pinch of Graphene Could Keep Airplane Wings Ice-Free. Gizmag reports; here’s the intro: “Both airplane wings and helicopter rotor blades are subject to one problem – they can both ice up. Although de-icing solutions can be applied when aircraft are on the ground, that doesn’t stop ice from eventually forming once they’re in the air. That’s why scientists at Texas’ Rice University have developed a new graphene-based coating that continuously melts ice by conducting an electrical current...”

The Happiest, Healthiest State in the USA Is… Big surprise: Hawaii! Maui sounds pretty good right now. Or the Big Island. I’d settle for Oahu. Here’s more from The Today Show: “Say “Aloha” to the good life if you’re lucky enough to be able to move to Hawaii. People who live in the postcard-beautiful state have the highest overall well-being in the U.S., according to the 2015 Gallup-Healthways Well-Being Index released on Thursday. The report measures how Americans feel about their physical health, social connections, finances, community and sense of purpose...” (Photo credit here).

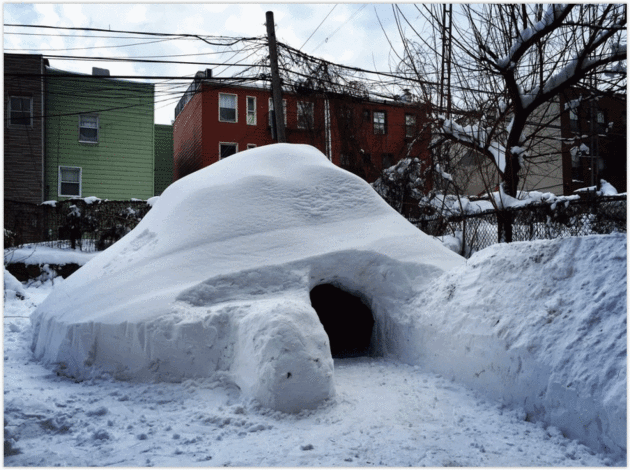
Behind the Scenes of Brooklyn’s Airbnb Igloo. Tempting, right? Here’s an excerpt from Atlas Obscura: “…The whole thing was meant to be funny and ridiculous, says Seeley, but they definitely didn’t think it would get as big as this. “I think part of the joke was us making fun of some of that [hipster] culture, which is maybe part of the reason that it was funny,” he says. Local film crews and reporters have been showing up, eager to get a glimpse of the icy abode, along with curious Brooklynites. The igloo is in their private yard, however, so access is quite exclusive. Structural integrity aside, with blankets, pillows, and mood lights, the igloo is pretty cozy. Seeley and his buddies think it’d be great for a first Tinder date—roomy and romantic, but chilly enough to encourage snuggling. In fact, they want to get the igloo sponsored by the dating app…”
Photo credit above: “The Boutique Igloo for 2: the perfect spot for a first Tinder date.” (All photos: Justin Seeley).

TODAY: Cloudy skies, a light mix possible. Winds: S 10-15. High: 34
FRIDAY NIGHT: Slushy mix, major roads mainly wet – icy secondary roads. Low: 30
SATURDAY: Overcast, mild for late January. Winds: SW 8-13. High: 38
SUNDAY: A little rain and drizzle potential. Winds: NW 7-12. Wake-up: 31. High: 36
MONDAY: Mostly cloudy, no travel headaches yet. Wake-up: 25. High: 29
TUESDAY: Enough PM snow to shovel & plow? Winds: NE 15-25. Wake-up: 20. High: 25
WEDNESDAY: Snow tapers to flurries. Slow AM Rush? Winds: NW 15-25. Wake-up: 13. High: 17
THURSDAY: Blue sky returns, looks like winter. Wake-up: 2. High: 14
Climate Stories…

NOAA: Global Warming May Affect Your Beer and its Price. No, not the beer! Here’s an excerpt from Citizen-Times: “…Heat and drought threaten to increase the cost of hops, which give beer much of its flavor, reported the National Oceanic and Atmospheric Administration’s Climate.gov website, and brewers in California have been scrambling to deal with water shortages that may or may not be related to global warming. An article posted on Climate.gov earlier this month says almost all of the United States’ hop production occurs in Washington, Oregon and Idaho, which saw a hotter and drier growing season in 2015 that threatened the size of the hops crop. June temperatures in the three states were the highest since the 1890s...”
The Zika Virus Foreshadows Our Dystopian Climate Future. Climate activist Bill McKibbon has an Op-Ed at The Guardian, here’s a clip: “…And now think about the larger, less intimate consequences: this is one more step in the division of the world into relative safe and dangerous zones, an emerging epidemiological apartheid. The CDC has already told those Americans thinking of becoming pregnant to avoid travel to 20 Latin American and Caribbean nations. Eventually, of course, the disease will reach these shores – at least 10 Americans have come back from overseas with the infection, and one microcephalic baby has already been born in Hawaii to a mother exposed in Brazil early in her pregnancy. But America is rich enough to avoid the worst of the mess its fossil fuel habits have helped create...”
Map credit: CDC.
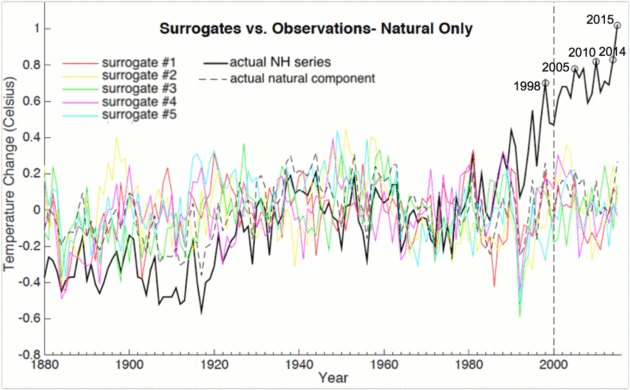
What Are The Odds? Temperature Records Keep Falling. Here’s an excerpt of an Op-Ed from climate scientist Michael Mann at livescience.com: “…While the precise results depend on various details of the analysis, for the most defensible of assumptions, our analysis suggests that the odds are no greater than one in 170,000 that 13 of the 15 warmest years would have occurred since 2000 for the Northern Hemisphere average temperature, and one in 10,000 for the global average temperature. Even when we vary those assumptions the odds never exceed one in 5,000 and one in 1,700, respectively...”
Graphic credit above: “Historical Northern Hemisphere mean-temperatures (black solid line) along with the estimated natural component alone (black dashed line) and five of the surrogates (colored curves) for the natural component. Temperature departures are defined relative to the long-term 1880 to 2015 average.”

The Arctic is Melting and Big Business is Chomping At The Bit to Dig In. Here’s are a couple of excerpts from ThinkProgress: “…This comes as studies have found that Arctic ice is receding and thinning at an accelerated pace. Annual mean ice thickness has decreased from nearly 12 feet in 1975 to some four feet in 2012, a 65 percent reduction, according to a 2015 study. Moreover, the Arctic warms twice as fast (or more) than the Earth as a whole does…..In 2009, only five cargo ships went through the Russian Northern Sea Route, according to a recent study by the Council on Foreign Relations. By 2013, that figured climbed to 71...”
Photo credit above: AP Photo/Elaine Thompson.
The Science for Climate Change Only Feeds The Denial: How Do You Beat That? More information, more data, more evidence doesn’t help (with some people). It merely feeds conspiracy theories. Here’s an excerpt from The Conversation: “…Conspiratorial thinking is problematic because it is immune to new evidence. Any evidence against the conspiracy is viewed as part of the conspiracy. As a consequence, climate science denial, and the generation of misinformation that comes with it, is not disappearing any time soon. This matters because several new studies have confirmed what many of us already suspected – misinformation is effective. Just a handful of cherry-picked statistics can reduce people’s acceptance of climate change. Of more concern to science communicators is the recent finding that misinformation can cancel out the positive effect of accurate information...”
Graphic credit above: “Most common responses to climate change by climate contrarians.” Smith & Leiserowitz, 2012.

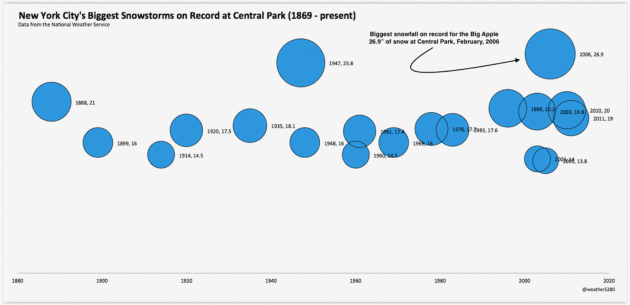
The Blizzard of 2016 Was Influenced by Manmade Global Warming. Here’s an excerpt from Mashable: “…Jay Lawrimore, a senior scientist at the National Centers for Environmental Information in Asheville, North Carolina, says that as the climate has warmed, years with “heavy seasonal snow and extreme snowstorms continue to occur with great frequency.” He has published research showing that the frequency of extreme snowstorms has increased in the eastern two-thirds of the U.S. during the past 50 years. “Approximately twice as many extreme U.S. snowstorms occurred in the latter half of the 20th century than the first,” he wrote in an email to Mashable...”
Graphic credit above: “Top NYC snowstorms over the years, showing the clustering toward recent years (top right).” Image: Weather5280
