
59 F. high in the Twin Cities Sunday.
46 F. average high on November 8.
43 F. high on November 8, 2014.
November 9, 2003: Parts of west central and north central Minnesota receive anywhere from 2 to 6 inches of new snow. Canby had the most at 6 inches and Benson measured 5 inches.
November 9, 1977: A foot of snow falls in Western Minnesota. I-94 is tied up.
November 9, 1850: The sky darkens at Ft. Snelling due to smoke from prairie fires.

Talking Trash – Who Really Has The “Best Weather”?
America, land of the free, home of the brave; as competitive about hometown weather as we are our favorite college football teams.
“It’s November and people are still boating!” I bragged to my oldest son in Seattle. “Oh yeah? Well, it’s raining here, but it’s a warm rain.” A friend in Scottsdale assured me “it’s a dry heat”. So is my oven but I don’t stick my head inside. Another friend in Naples is really looking forward to January. “Puffy cumulus clouds, 80 degrees, what’s not to like?” Storms with names, for one. Even Maui, as close to perfect as you can get, sees occasional hurricanes.
Is there a place with “perfect weather” and no risk? I’m not so sure that exists.
I’m feeling even better about Minnesota, especially considering El Nino warmth coming out of the Pacific should take some of the edge off the winter to come.
Right now I don’t see any snowstorms between now and Thanksgiving. The atmosphere will be warm enough for rain Wednesday into Thursday morning; some .5 to 1 inch amounts possible.
Minor league cold fronts arrive late week, again late next week – but nothing polar. Nothing that’ll make you want to call a travel agent. November Lite continues.
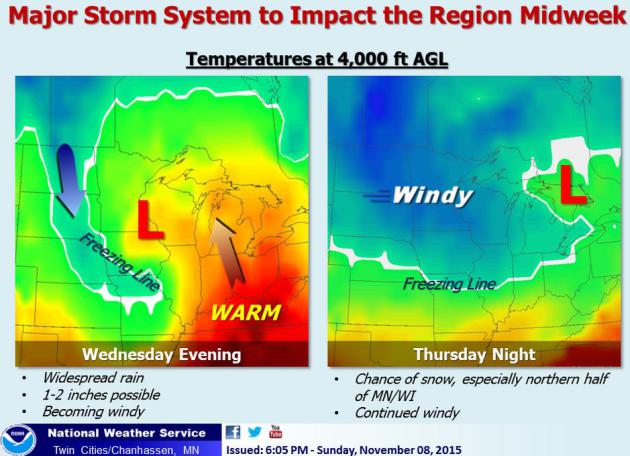
Midweek Rain Event. Significant rain is still likely from Wednesday PM into Thursday morning as a storm tracks almost directly over MSP; the lowest mile of the atmosphere warm enough for mostly rain, although wrap-around moisture coupled with falling temperatures could spark a few snow showers up north late Thursday. Details from the Twin Cities National Weather Service: “A significant storm system pushing through midweek will be capable of bringing heavy rainfall and strong winds to the Upper Mississippi Valley late Wednesday and Wednesday night. Severe weather is also likely to the south. Wrap around snow showers are possible Thursday night, especially across northern Minnesota and Wisconsin.”
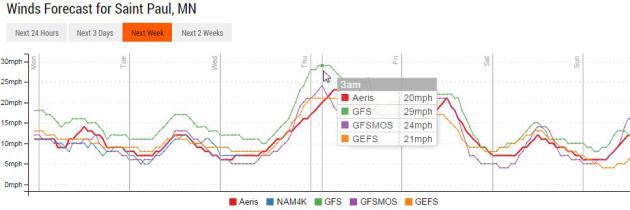
An Actual “Storm”. Remember those? It’s been a little while since we’ve had a heavy, stratiform rain event, but it seems to be real this time around, a tight pressure gradient around an intensifying storm whipping up sustained winds of 25-35 mph late Wednesday night and early Thursday. Map: Aeris Enterprise.
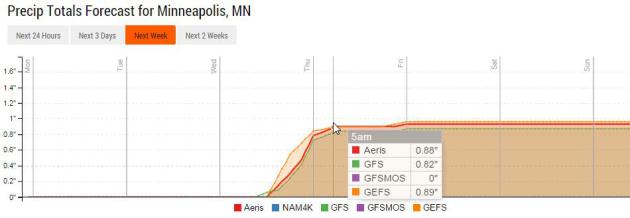
Potential Soaker. Models suggest .80 to .90″ for the Twin Cities, with most of the rain coming from noon Wednesday to abouut 8 AM Thursday.
NAM Guidance. NOAA’s 12 KM NAM model shows soaking rains for much of the east coast, a smear of moderate to heavy rain breaking out Wednesday into Thursday from Omaha to Mankato and the Twin Cities. Source: NOAA and AerisWeather.
10-Day Snowfall Potential. A few inches of snow are predicted for the Rockies and northern New England; some lake-effect snow showers kicking in behind a big storm spinning up over the Great Lakes by Thursday. The GFS model (above) hints at a litlte smear of slushy snow pushing into southern Minnesota early next week. We’ll see.
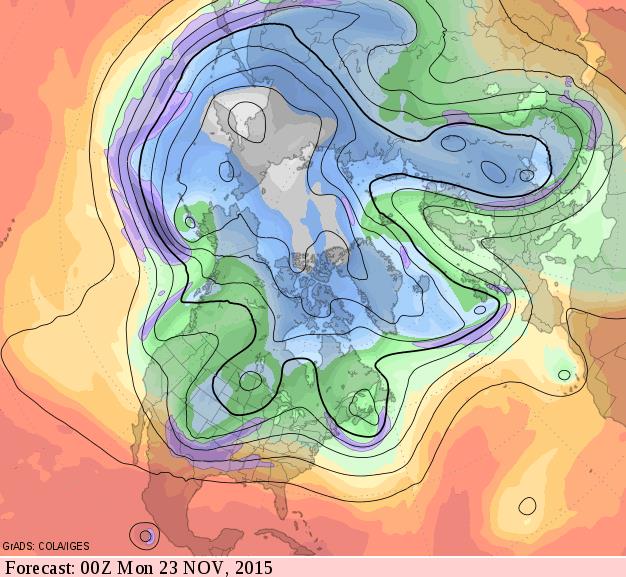
Stormier Pattern Thanksgiving Week? The GFS 500 mb pattern suggests a deep trough, even a cut-off low over the Red River Valley within 2 weeks, with temperatures marginally cold enough for snow, or a rain/snow mix. Thanksgiving is coming – what can go wrong? Source: GrADS: COLA/IGES.
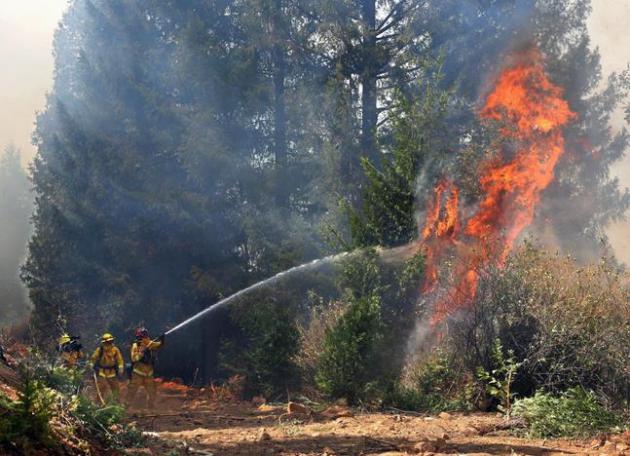
Climate Change and Extreme Weather: 32 Takes on 28 Events from 2014. Bob Henson has a comprehensive update and some interesting insight at a Weather Underground post; here’s an excerpt: “…Lurking in the background of any attribution study is the natural variation inherent in our weather and climate system. Researchers go to great lengths to separate any influence of climate change from the kinds of ups and downs one would expect in a climate that didn’t have ever-increasing greenhouse gases. This year, the states of New York and Vermont had their coldest January-to-March period since records began in 1895, with all of the Northeast in their top-ten coldest. Surely, the odds of getting such widespread, persistent, intense cold over this large an area in a warming climate must be phenomenally low–but sometimes, even very unlikely things happen. This paradoxical, high-impact event gets my vote for inclusion in next year’s BAMS attribution report. Stay tuned!…” (September 17, 2014 file photo from Fresh Pond, California: AP Photo/Rich Pedroncelli.)
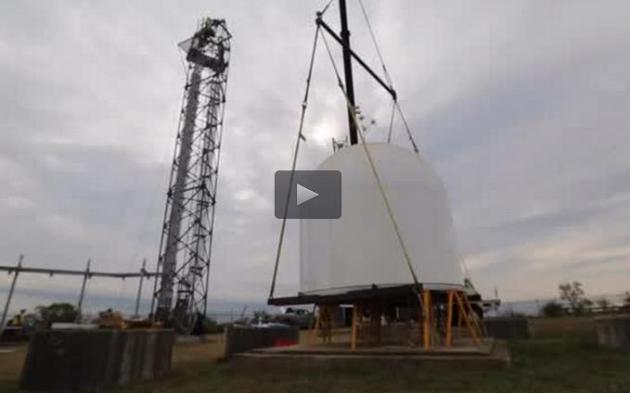
CASA’s Radars Provide a New Set of Eyes on DFW’s Severe Storms. The Star-Telegram takes a look at a new generation of radar systems that have less range, but faster refreshes and more power resolving rotating storms in the lowest levels of the atmosphere; here’s an excerpt that caught my eye: “…The CASA radars aren’t as powerful as the NEXRAD (next generation) radars that the weather service uses to see as far out as 150 miles. Instead, the CASA radars have a 25-mile radius and look into the lower levels of the storm, below 32,000 feet, where much of the damaging parts of the storm take place. CASA’s network can refresh the image every 30 to 60 seconds versus up to 5 minutes for NEXRAD radars. “The majority of damage happens in the lower portion of the storm,” said Juan Ortiz, Fort Worth’s emergency management coordinator…”
El Nino Hits Dinner Table as Food Costs Soar Most in 3 Years. Bloomberg Business connects the dots; here’s a clip from a recent article: “The effects of El Nino are starting to reach the dinner table, with global food prices rising the most in three years on supply concerns for everything from New Zealand milk to sugar in Brazil and Southeast Asian palm oil. An index of 73 food prices increased 3.9 percent, the biggest jump since July 2012, to 162 in October, the United Nations Food & Agriculture Organization wrote in a report Thursday. The return of the El Nino weather phenomenon is changing weather conditions around the world, damaging crops with too much rain in some areas and not enough in others…”
Image credit here.

How Realistic is “The Walking Dead”? Ranking Pop Culture’s Worst Zombie Outbreaks. Here’s an excerpt from Quartz: “…The upshot is that there’s no need to fear an undead apocalypse—at least not of the nature most commonly presented in popular culture. That said, these infection scenarios should at the very least get people thinking about the importance of preparing a “bug out” bag and stocking up on supplies of food and water for natural disasters. And one last thing: get your flu shot while you’re at it.”

TODAY: Mild sunshine, no weather-worries. Winds: S 10-20. High: 59
MONDAY NIGHT: Clear and comfortable. Low: 41
TUESDAY: Plenty of sunshine, still quiet. High: 57
WEDNESDAY: Rain arrives PM hours. Wake-up: 45. High: 54
THURSDAY: Periods of rain, ending by afternoon. Winds: NW 15-30. Wake-up: 42. High: 47
FRIDAY: Mostly cloudy, jacket weather. Winds: NW 10-20. Wake-up: 35. High: 42
SATURDAY: Lot’s of sun. Not bad at all. Winds: SW 10-15. Wake-up: 30. High: 52
SUNDAY: Plenty of sun, still above average. Winds: NW 8-13. Wake-up: 37. High: 52
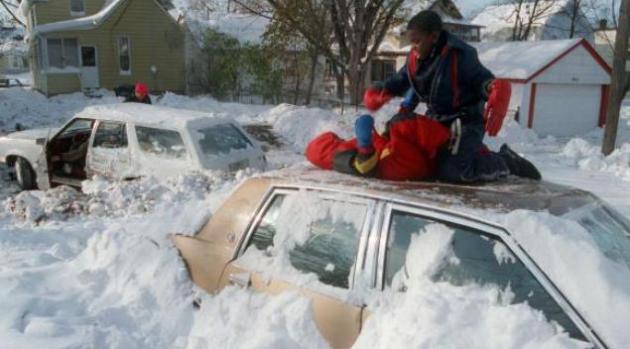
* File photo from the 1991 Halloween Superstorm courtesy of The Star Tribune.
Climate Stories…
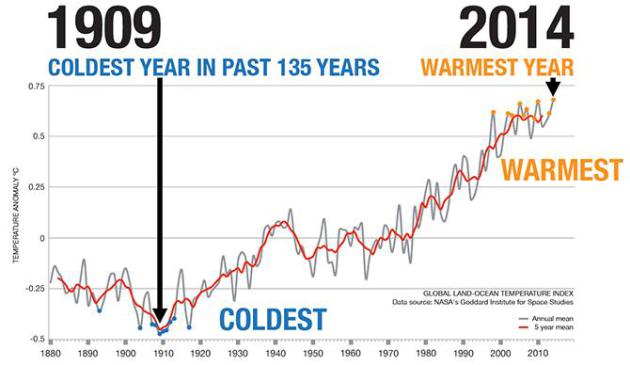
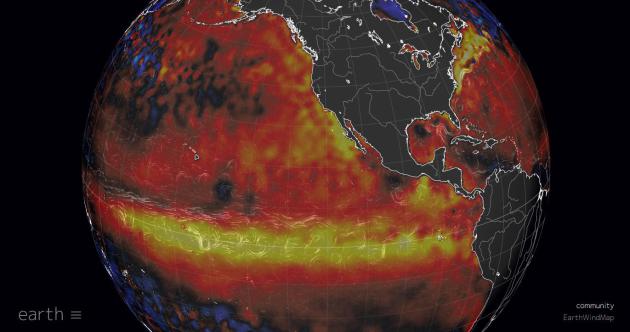
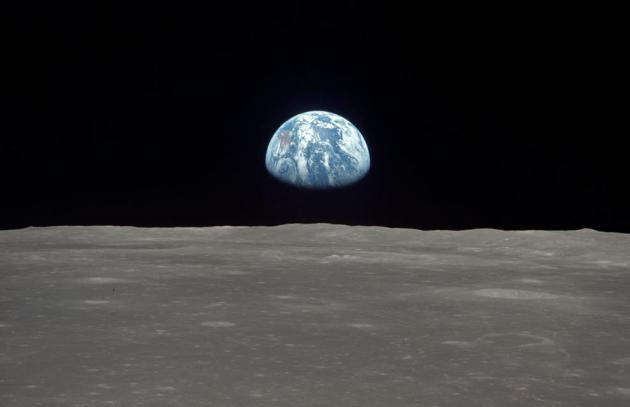
10 Coldest and Warmest Years. NASA’s Global Climate Change web site has more perspective on the ongoing accumulation of weather coincidences: “This animated GIF shows landmark moments that happened during the warmest and coldest years in modern record.”
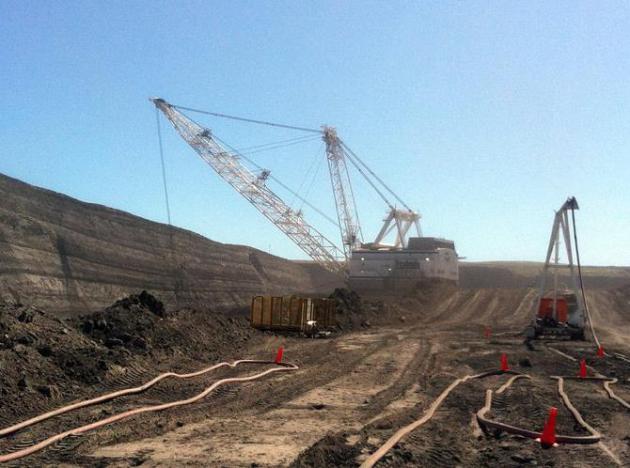

Climate Change: Have We Already Gone Too Far? Additional warming, volalility and potential weather and water disruption is already in the pipeline – we won’t have any choice but to adapt as we attempt to mitigate; here’s an excerpt from Forbes: “…But while President Obama may aim to put the US into a leadership position in the climate change issue, a new international study on how cities and SMEs are working to become more resilient to the consequences of climate change shows that more than 40% of those US and UK SMEs studied have no resilience plans in place and no plans to develop one in the near future. Additionally, Urban Leaders believe we have already come too far to fully mitigate the threat of climate change, according to parallel research from Penn Schoen Berland (PSB), an American market research, political polling and strategic consulting firm founded in 1975 and acquired by WPP in 2001. What’s needed, therefore, is a resilience strategy combining mitigation and adaptation at the local, national and global levels...”
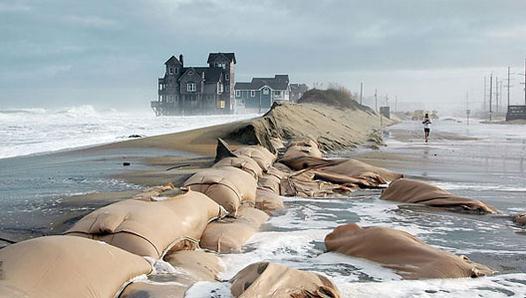
20 Million Americans Threatened by Rising Seas? Maybe I’m interpreting this paper wrong, but the authors look at the implications of rising seas and the percentage of Americans impacted by the end of the 21st century. Here’s an excerpt of the abstract at PNAS: “…Analysis based on previously published relationships linking emissions to warming and warming to rise indicates that unabated carbon emissions up to the year 2100 would commit an eventual global sea-level rise of 4.3–9.9 m. Based on detailed topographic and population data, local high tide lines, and regional long-term sea-level commitment for different carbon emissions and ice sheet stability scenarios, we compute the current population living on endangered land at municipal, state, and national levels within the United States. For unabated climate change, we find that land that is home to more than 20 million people is implicated and is widely distributed among different states and coasts...” (File photo: Andrew Demp, Yale).
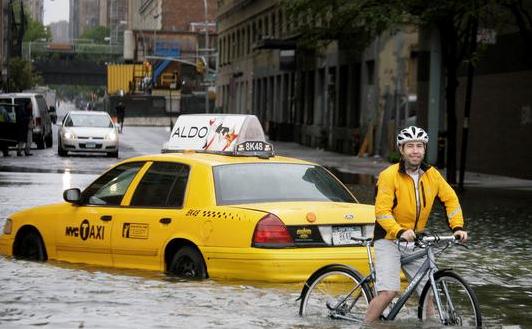
New York Prepares For Up to 6 Feet of Sea Level Rise. Here are a couple of excerpts from a related story at msn.com: “LaGuardia Airport is about to be rebuilt in New York City, but by the end of the century, fish could be swimming where airplanes once parked at the terminal. That’s because sea levels in the area could rise by as much as 6 feet over the next 75 days, according to new predictions released by the state of New York…About 500,000 people live on the 120 square miles of land that lie less than 6 feet above the mean high tide line in the state of New York. More than $100 billion in property value exists in that area…”
File photo: Peter Morgan, AP.
